
Google Analytics is like an iceberg. 91% of it is below the surface.
So, when you’re browsing around the standard reports, checking your monthly visitor count or your daily revenue, you’re only getting about 9% of what Google Analytics has to offer.
The rest is hidden below the surface, just waiting to be discovered.
One of the best ways to start exploring the Google Analytics iceberg is through segments, both simple and advanced.
What are Google Analytics segments?
Google Analytics segments allow you to drill down and extract deeper insights from the data you’ve collected.
So, for example, you might wonder how mobile visitors and desktop visitors differ. By creating a mobile segment and a desktop segment, you can navigate reports to compare the data side by side to identify behavioral changes.
Note that:
- You can only apply four segments to a report at one time.
- AdWords cost data is not compatible with segments (will display as 0).
- You should use conversion segments for multi-channel funnel reports.
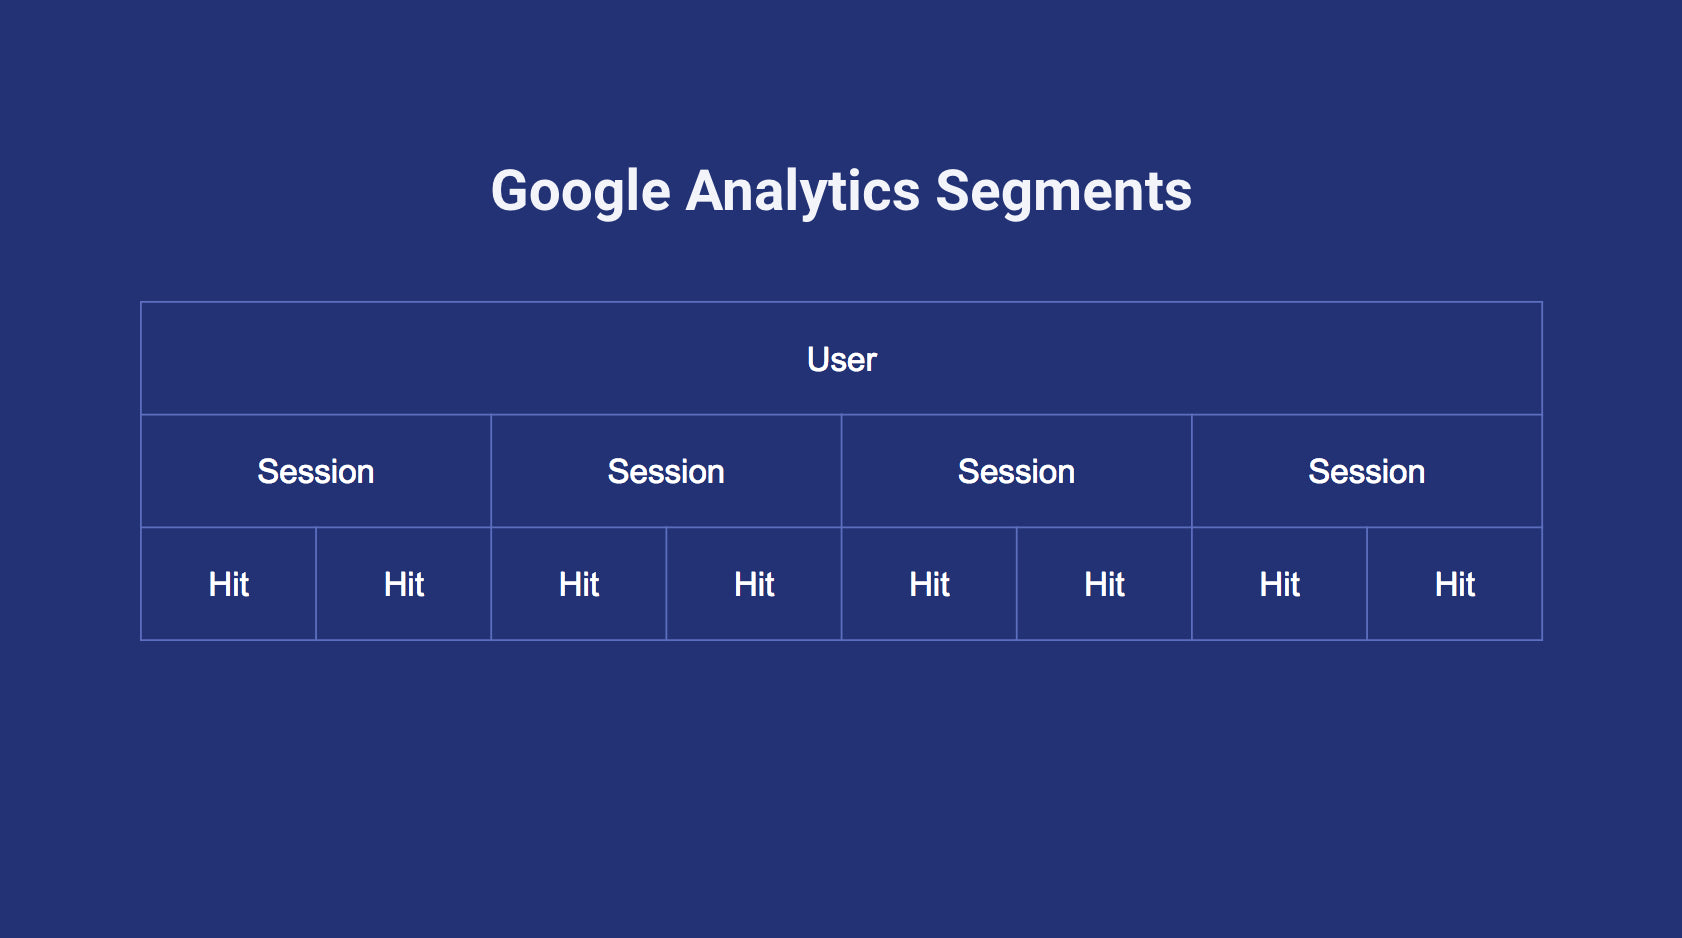
User segments, session segments and hit segments
Before we continue, it’s important to understand the different segment levels. There are three:
- User: Actual people visiting your site.
- Session: Site interactions by a single person grouped into what Google Analytics calls sessions.
- Hit: Site interactions during a session.
So, a single person can generate multiple sessions and each session can then have multiple hits.
Let’s say, for example, you want to isolate all of the people who have spent more than $300 on your site. User A might have spent $50 during one session and $250 during another session while User B spent $300 in just one session. In a user segment, both would be included. In a session segment, only User B would be included.
Starting to see the difference?
Then, of course, hit segments are even lower level. Perhaps visiting a specific page or starting a video.
Note that user segments can only apply a maximum date range of 90 days for reports. If your date range is larger, it’s easy to miss the automatic switch to 90 days, so beware.
Simple segments
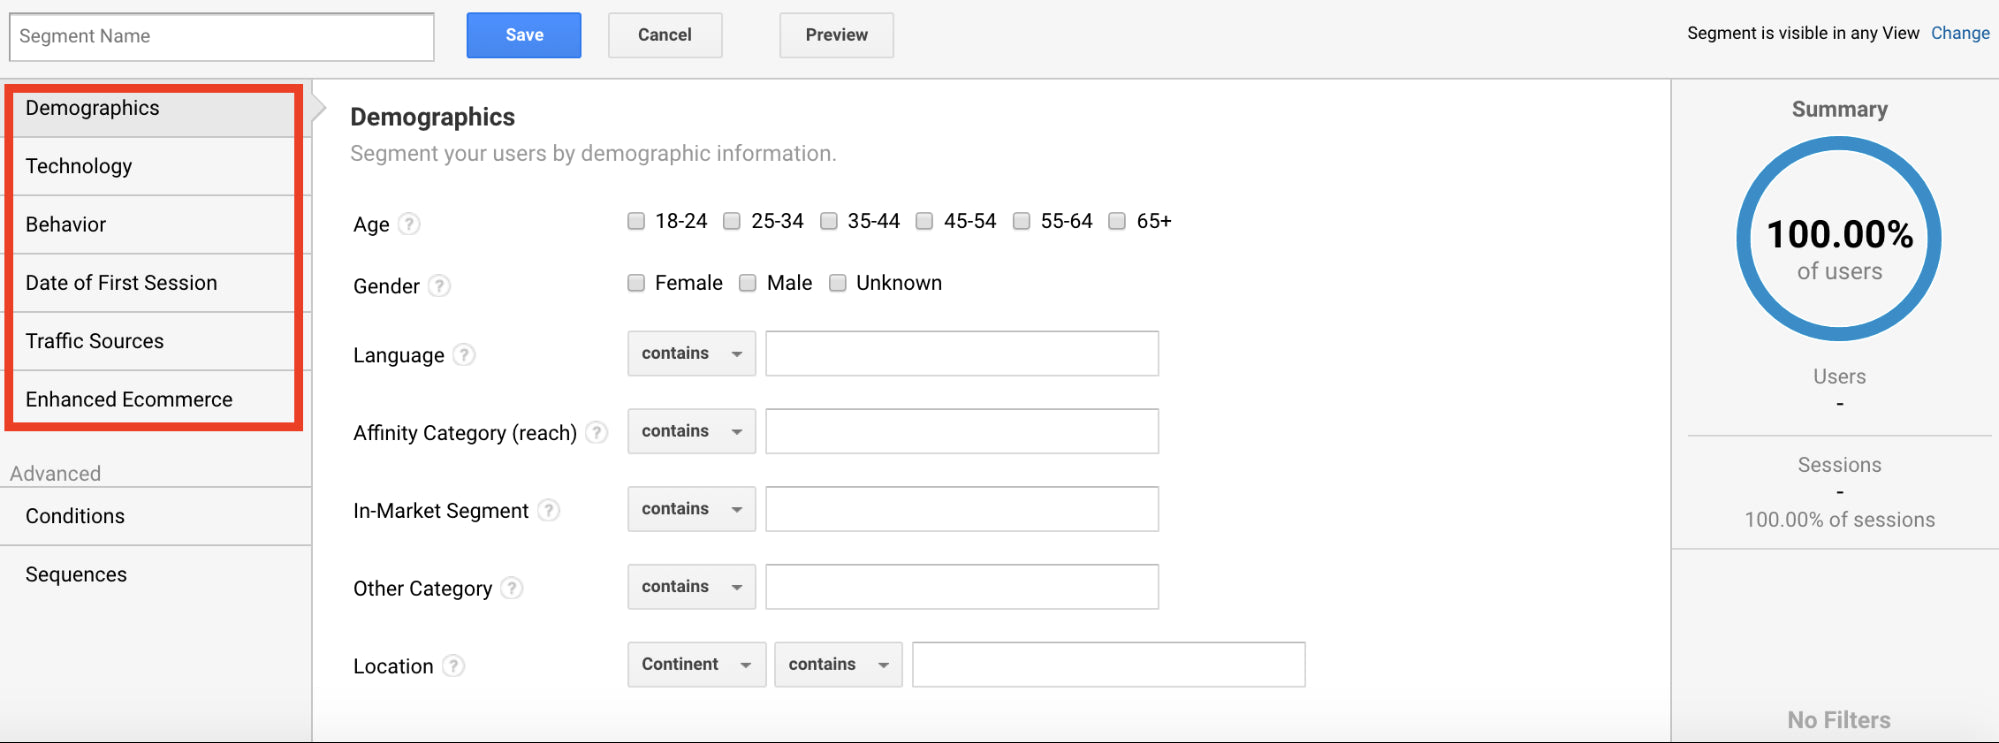
Simple segments include:
- Demographics: Segment your users by demographic information
- Technology: Segment your users’ sessions by their web and mobile technologies.
- Behavior: Segment your users by how often they visit and conduct transactions.
- Date of First Session: Segment your users (create cohorts) by when they first visited.
- Traffic Sources: Segment your users by how they found you.
- Enhanced Ecommerce: Segment your users by their shopping behavior.
Advanced segments
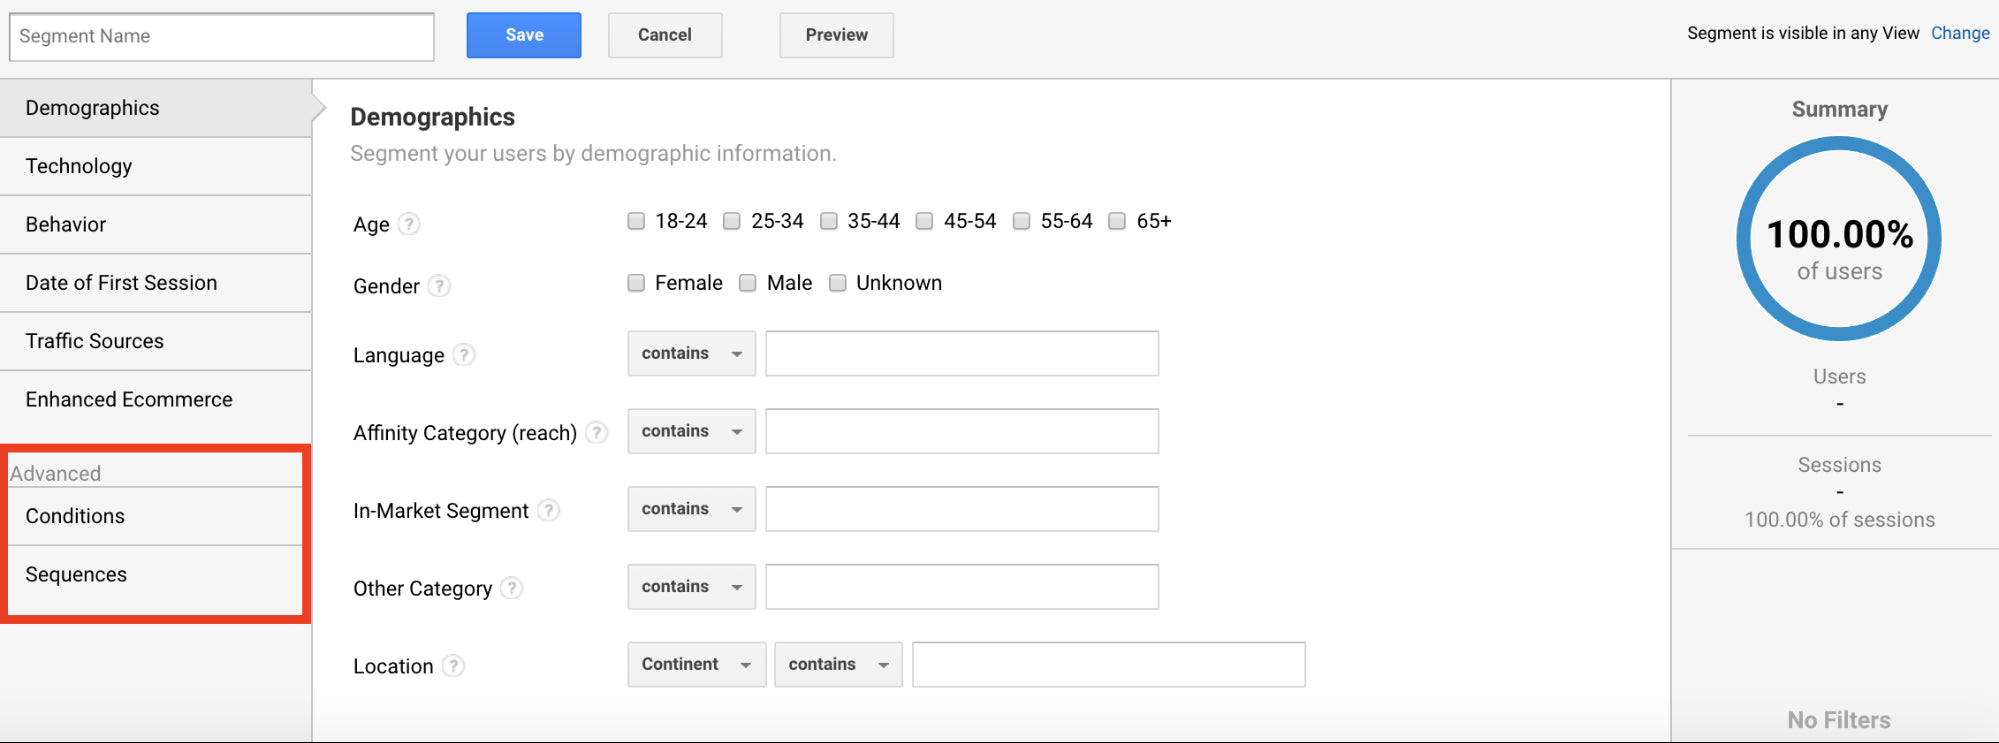
Below the simple segments, you have the advanced segments:
- Conditions: Segment your users and/or their sessions according to single or multi-session conditions.
- Sequences: Segment your users and/or their sessions according to sequential conditions.
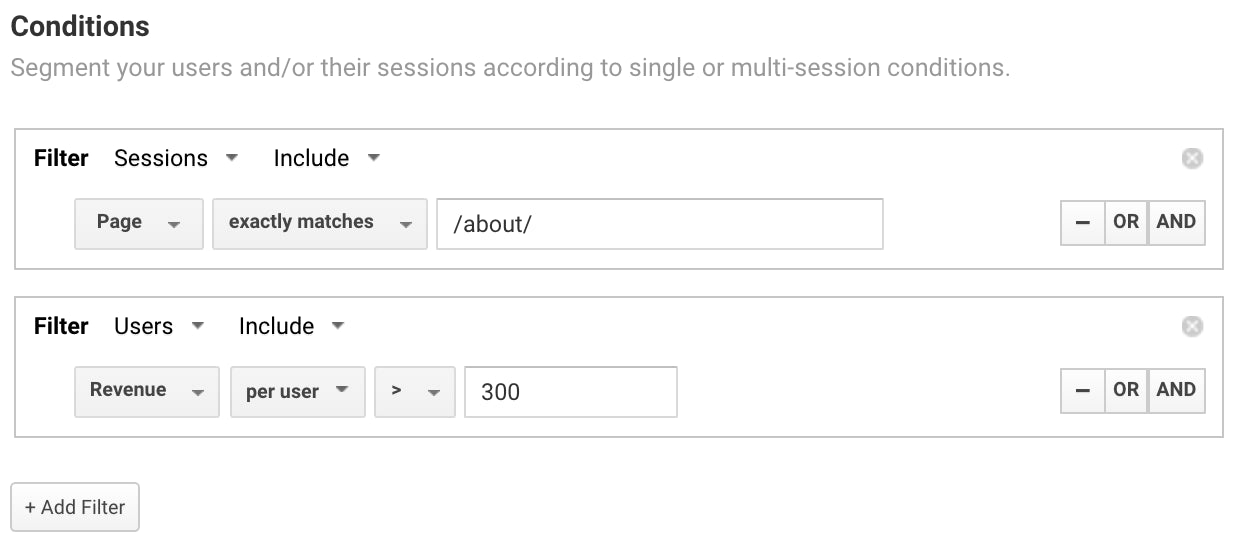
For example, if you wanted to understand how reading your store’s about page impacts revenue per visitor, you could use conditions:
Sequences are particularly interesting for us in the ecommerce space. For example, let’s say you want to isolate people who abandoned their cart:
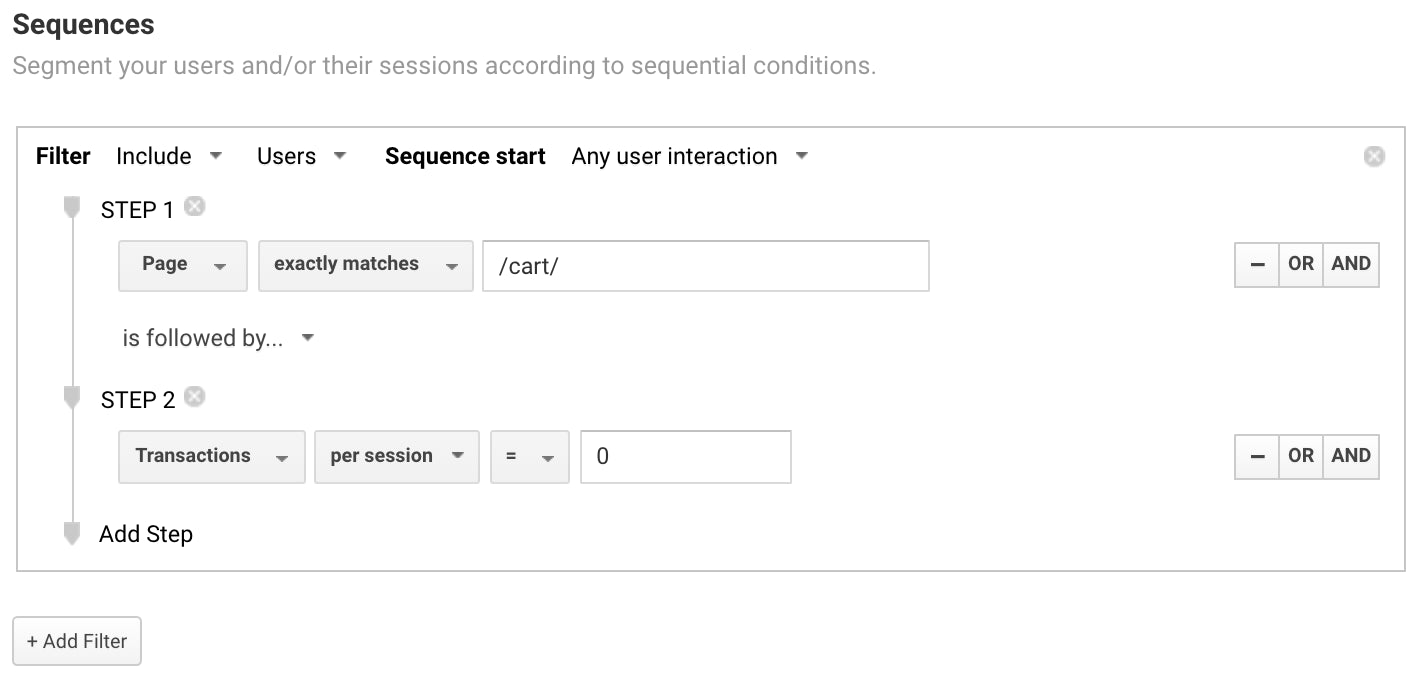
You’ll notice there’s simply more flexibility, more room for customization. Conditions and sequences require a bit of a deeper understanding to create than the simple segments.
Why do Google Analytics segments matter?
When you open up Google Analytics, you’re looking at the aggregate data of all of your visitors. That’s useful for a quick pulse check, sure, but remember the proverbial iceberg. There are a lot of insights hidden below the surface, beyond the aggregate.
As Avinash Kaushik famously said, “All data in aggregate is crap.”
If you don’t slice and dice your data with Google Analytics custom reports and segments, you’re going to completely miss that 91%.
Plus, if you use AdWords or Google Optimize for on-site experiments, you can really leverage segments. Once you isolate a segment, you can then use that segment as the basis for an audience.
Let’s say you’ve isolated the cart abandoners from the example above. Now you can easily launch an AdWords remarketing campaign offering them a discount on the items in their cart (or whatever you think will work for your audience).
How to create a Google Analytics segment
Would it surprise you to learn that you already have Google Analytics segments waiting for you?
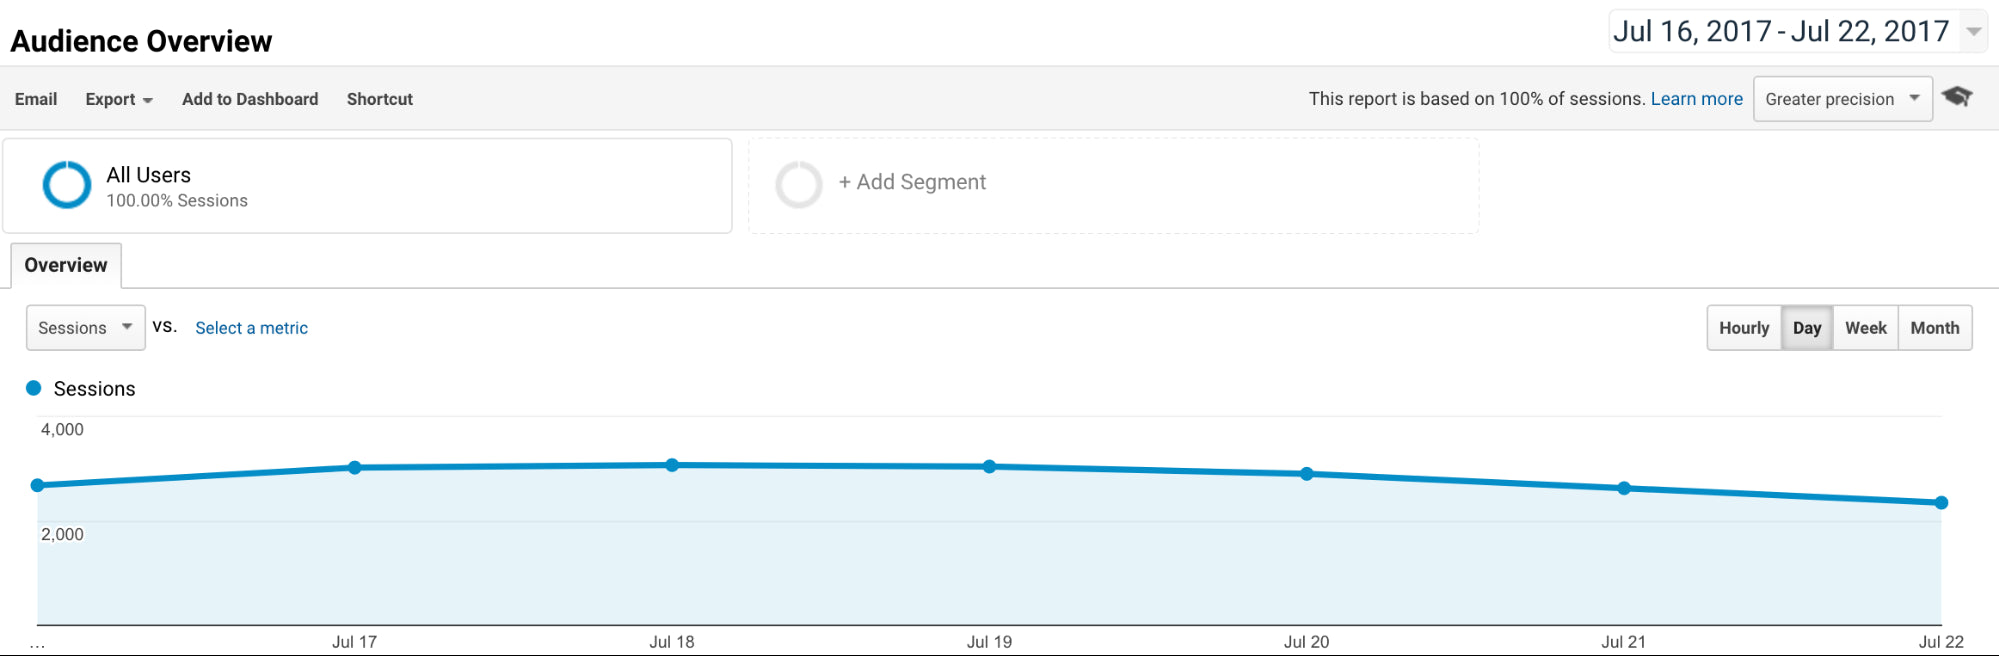
Open Google Analytics and look for “+ Add Segment” at the top:
Clicking that will open up your segments:
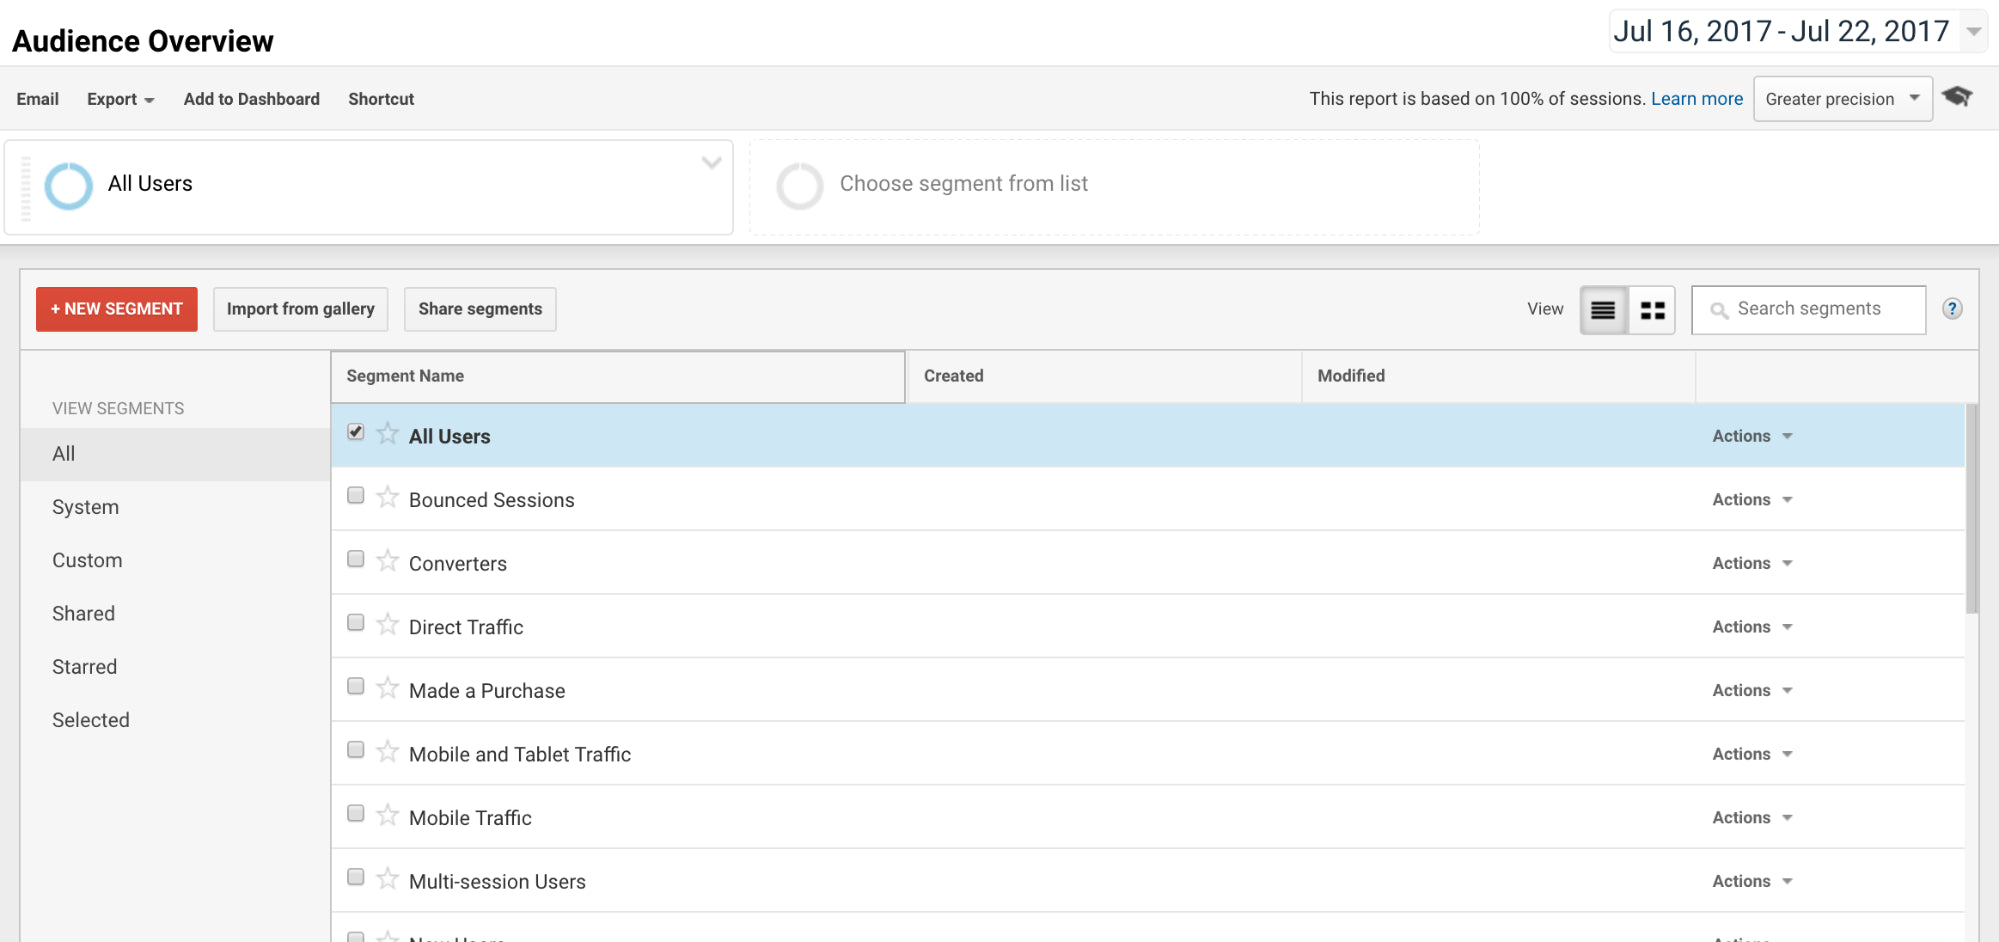
Under “View Segments”, you’ll find:
- All: Ok, this one’s pretty self-explanatory.
- System: Pre-built segments from Google Analytics.
- Custom: Segments you’ve built yourself.
- Shared: Segments can be shared to different views and users.
- Starred: Segments you’ve favorited.
- Selected: Segments that are currently active.
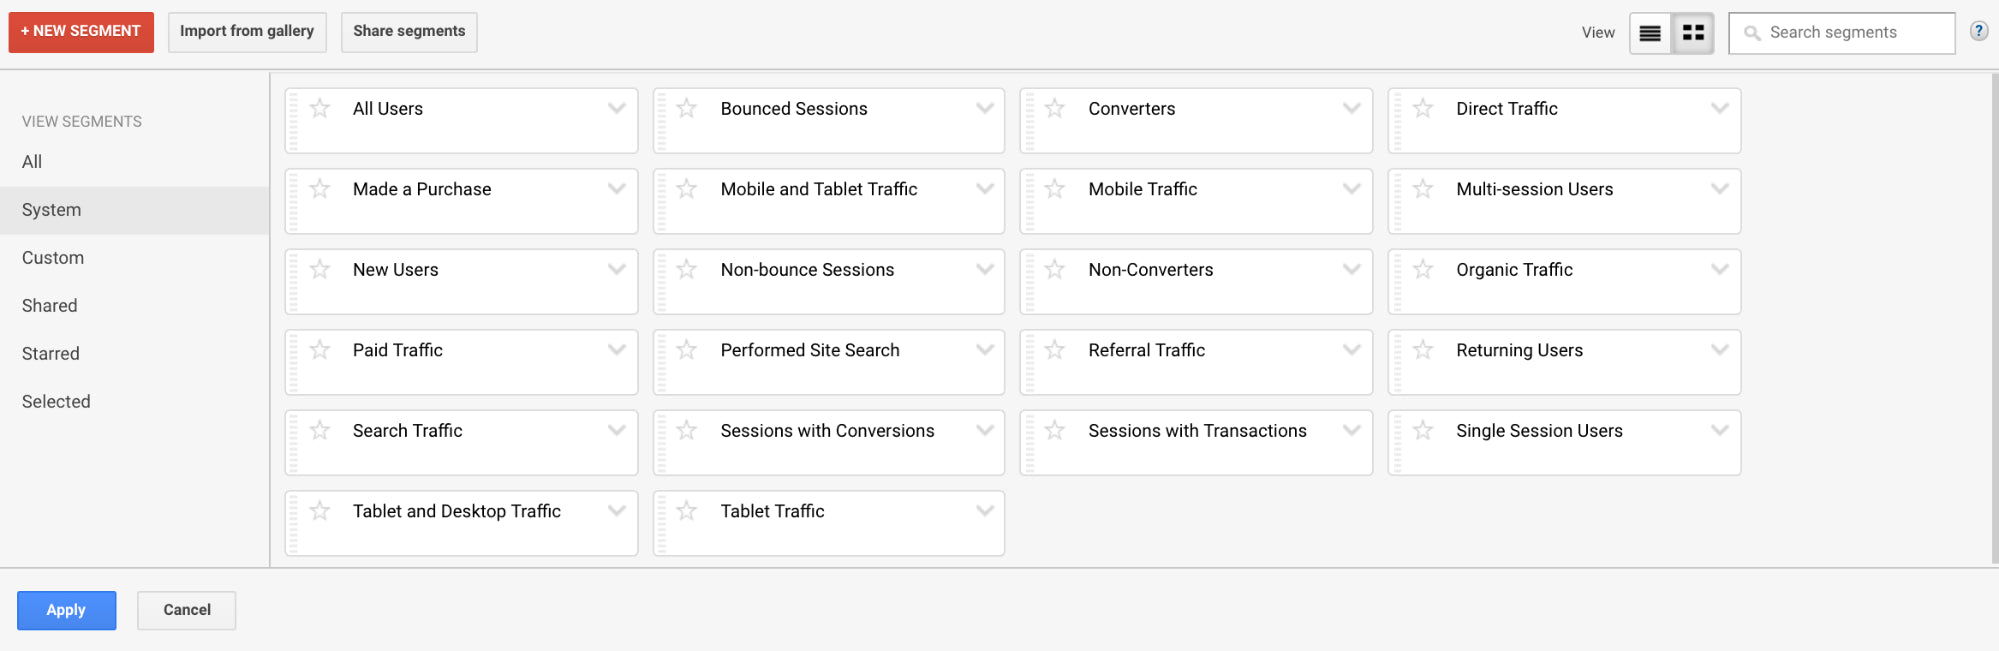
If you select “System”, you’ll find a whole bunch of segments Google Analytics has pre-built for you:
Of course, you can also start building out that “Custom” category. To get started, hit that bright “+ NEW SEGMENT” button. The resulting screen should look pretty familiar:
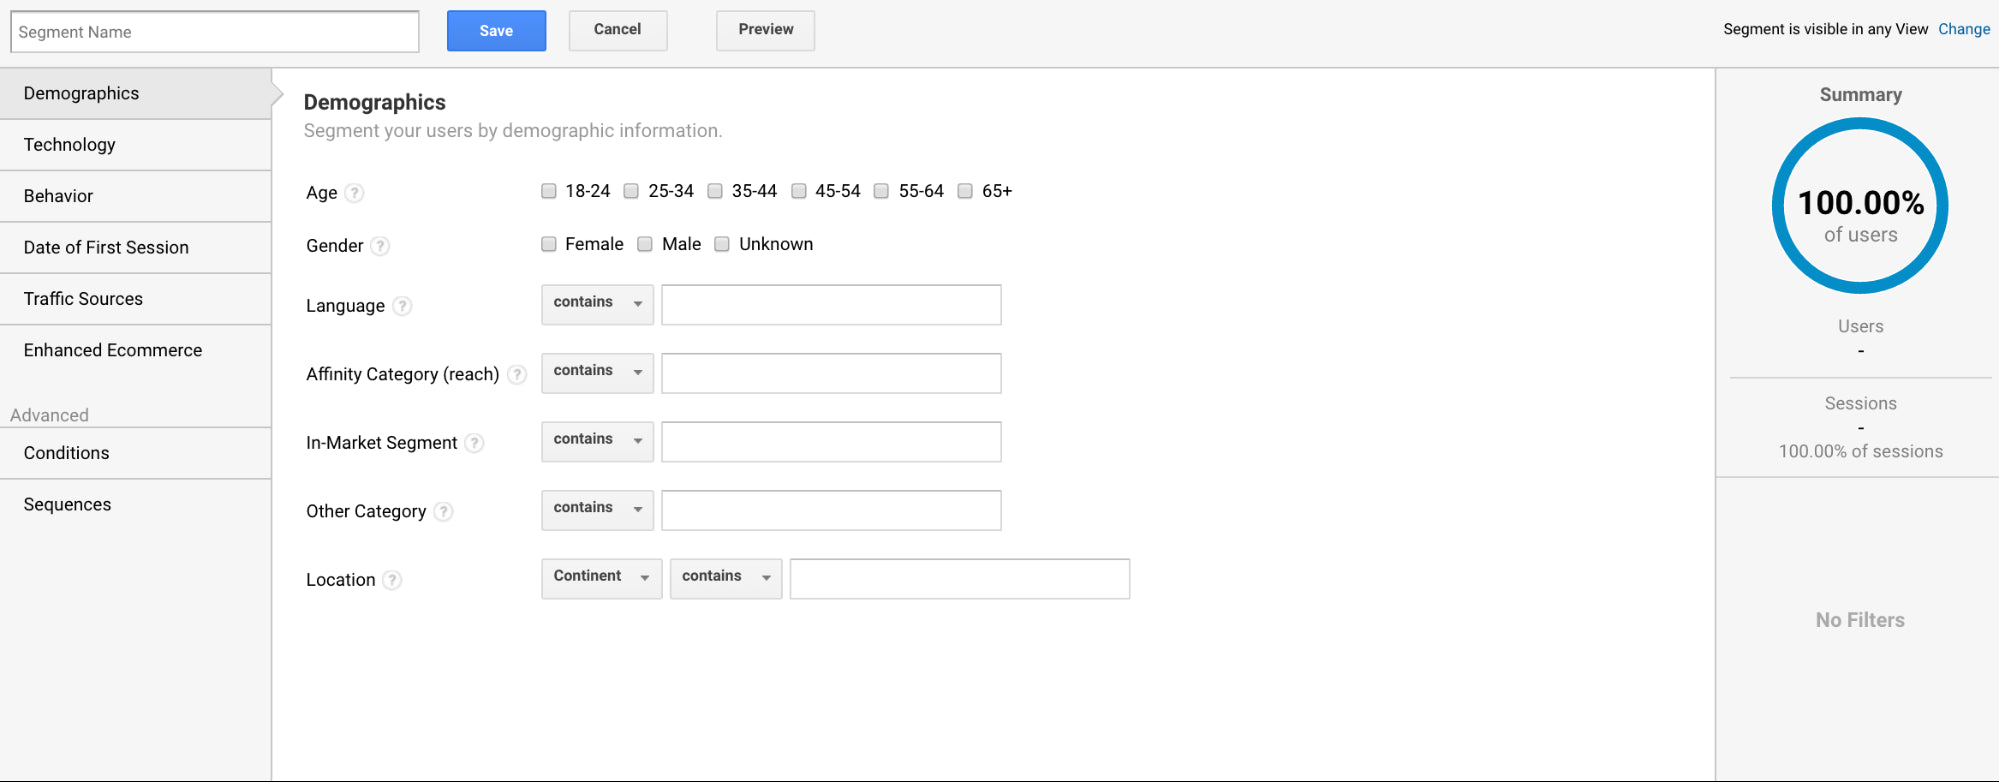
Now decide if you’ll go with a simple segment or an advanced segment.
Note that each filter has a help icon (?) beside it, in case you’re unsure at any point.
As you start applying filters, you’ll notice the summary pane to the right begin to change:
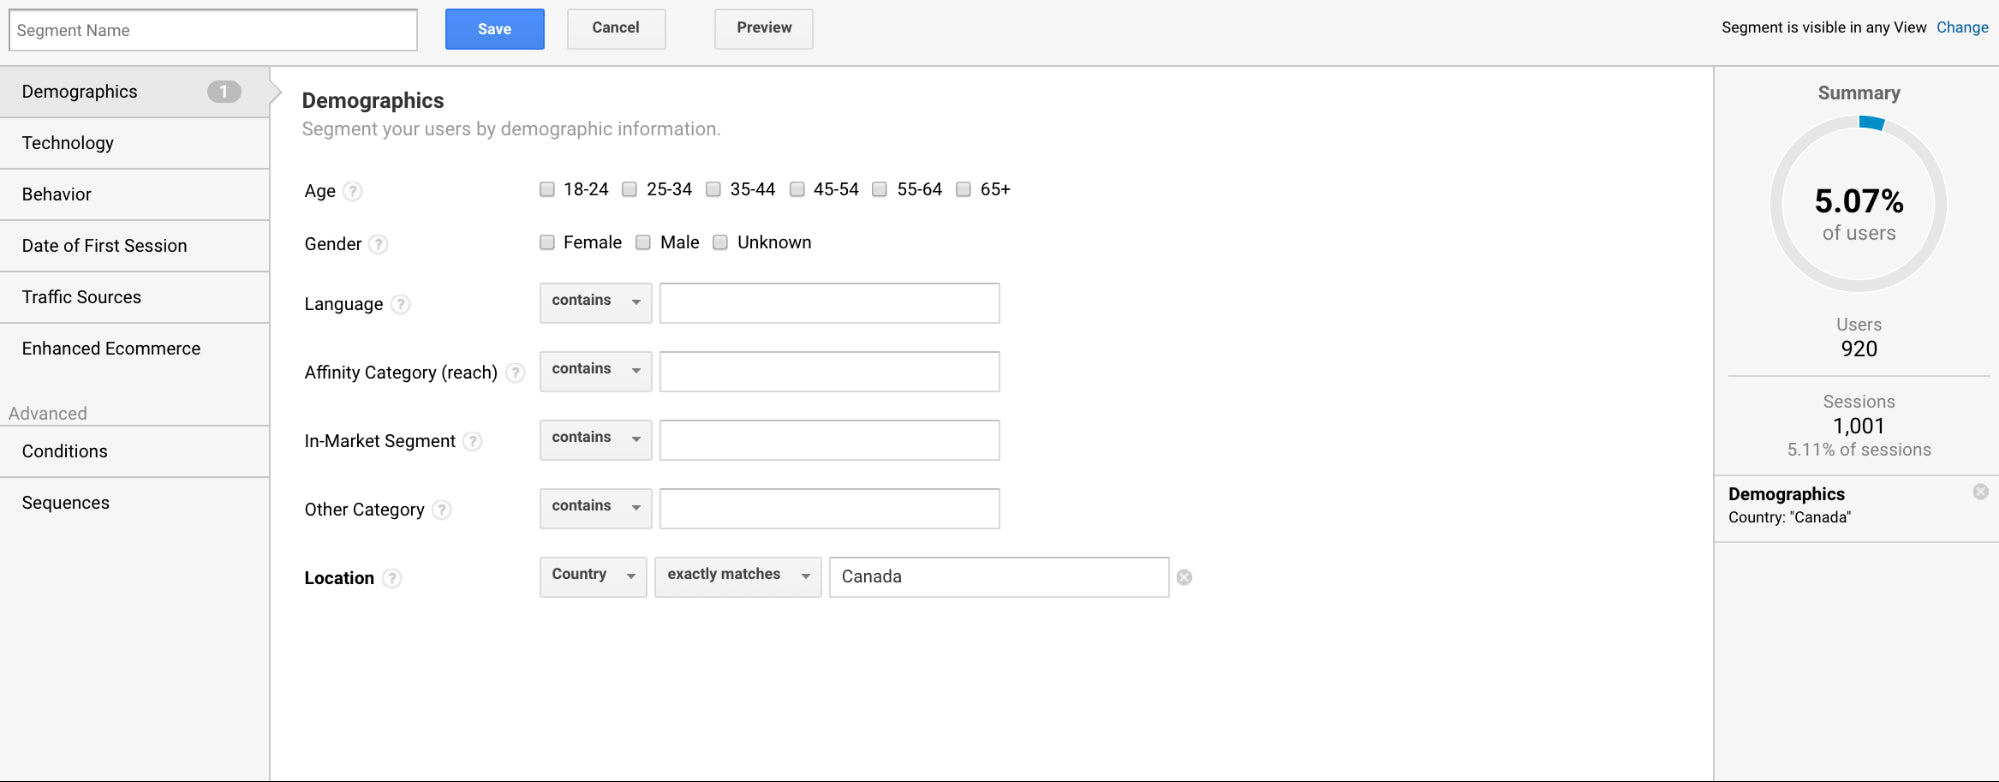
It’ll show you: the percent of users you’ve isolated, the actual user and session data, and the specific filters you’ve applied.
Once you’re happy with the segment, give it a name (top, left-hand order) and click the blue “Save” button.
When you return, simply select the filters you want to apply and click the blue “Apply” button:
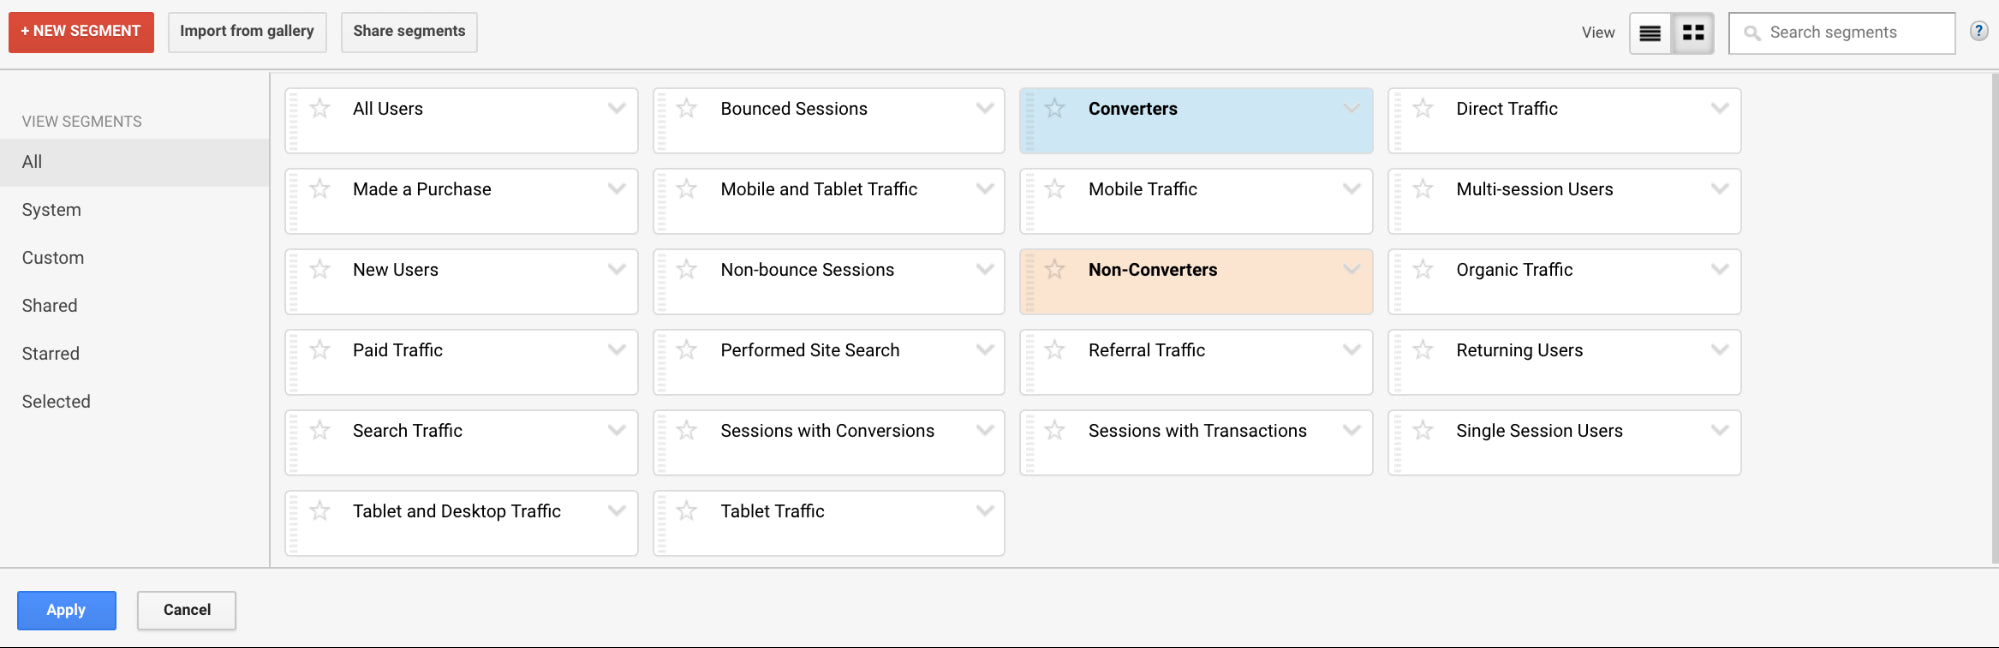
Once you’ve done that, the report you were viewing will reload and display the segmented data.
5 Google Analytics segments to try
If you aren’t satisfied with the pre-built Google Analytics segments, fear not. You can always head over to the Google Analytics Solutions Gallery to import some segments created by your peers:
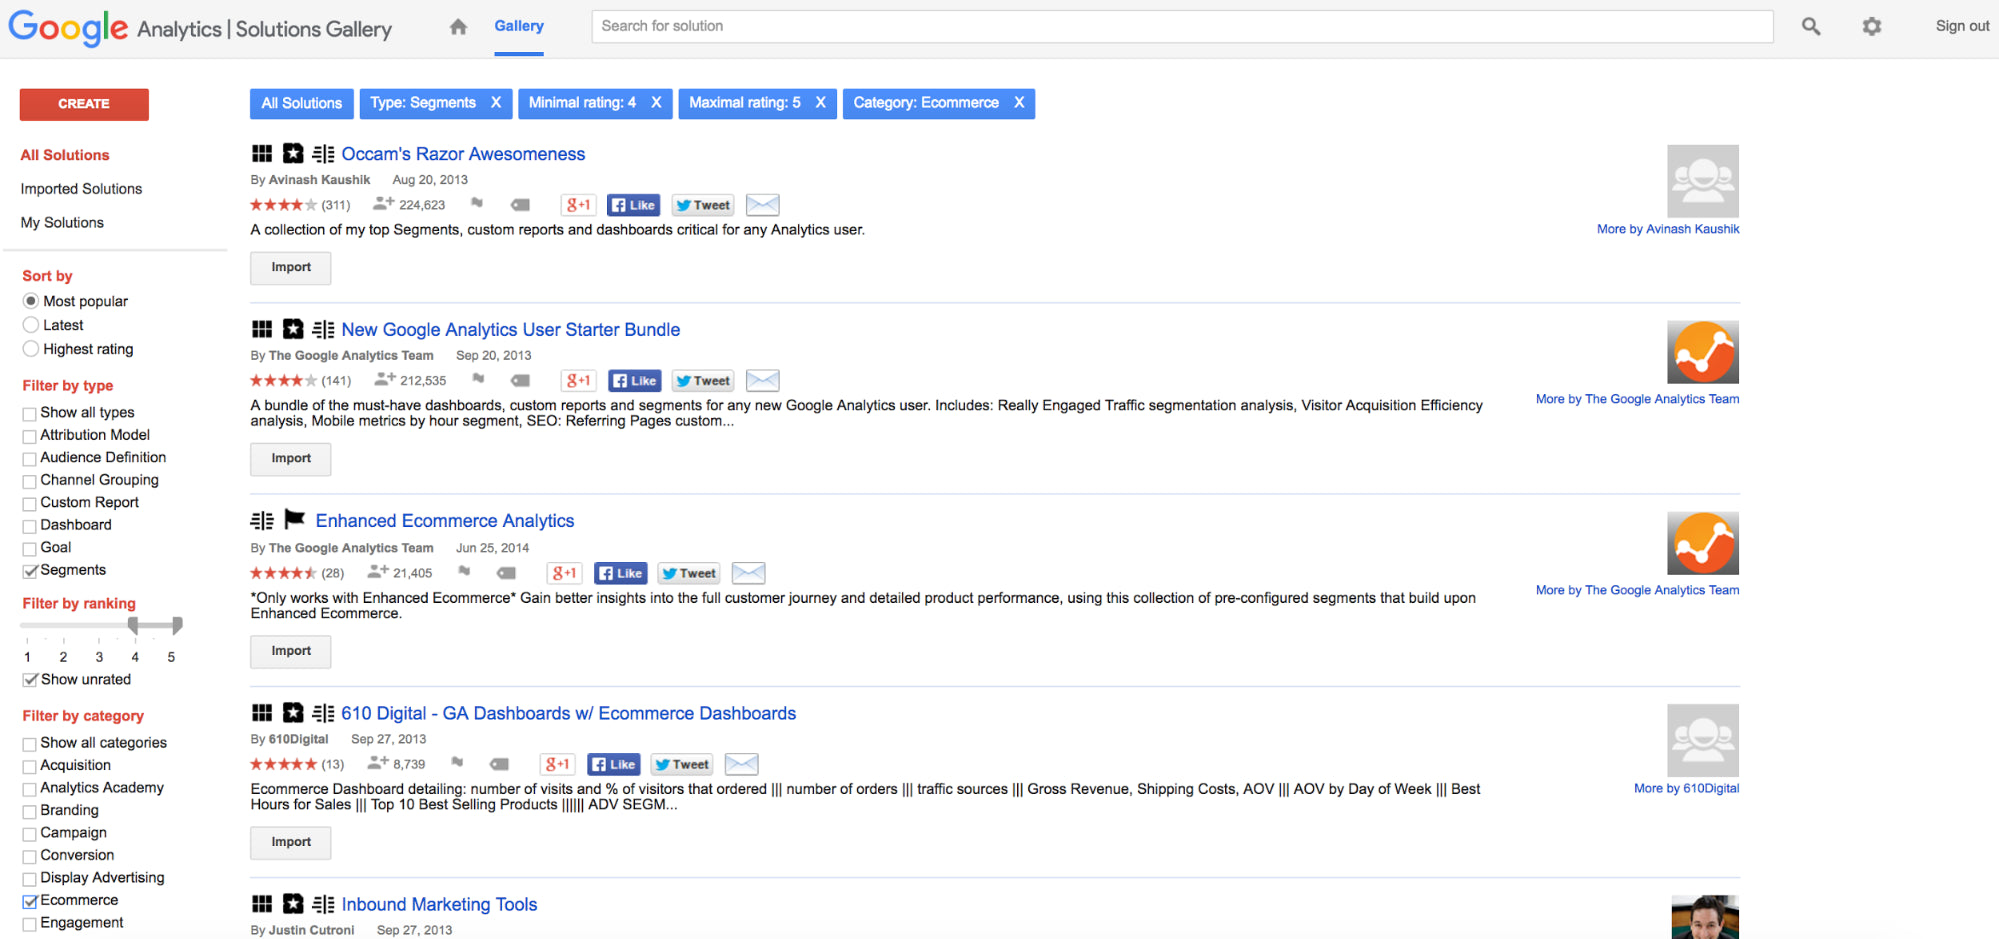
Just use the filters along the side to find top-rated custom segments.
Alternatively, you can try creating one or two of my favorite Google Analytics segments.
1. Purchasers vs. non-purchasers
This is similar to the converters vs. non-converters segment you saw above in that it's an important part of your marketing analytics, but if you hover over that pre-built segment, you’ll notice:
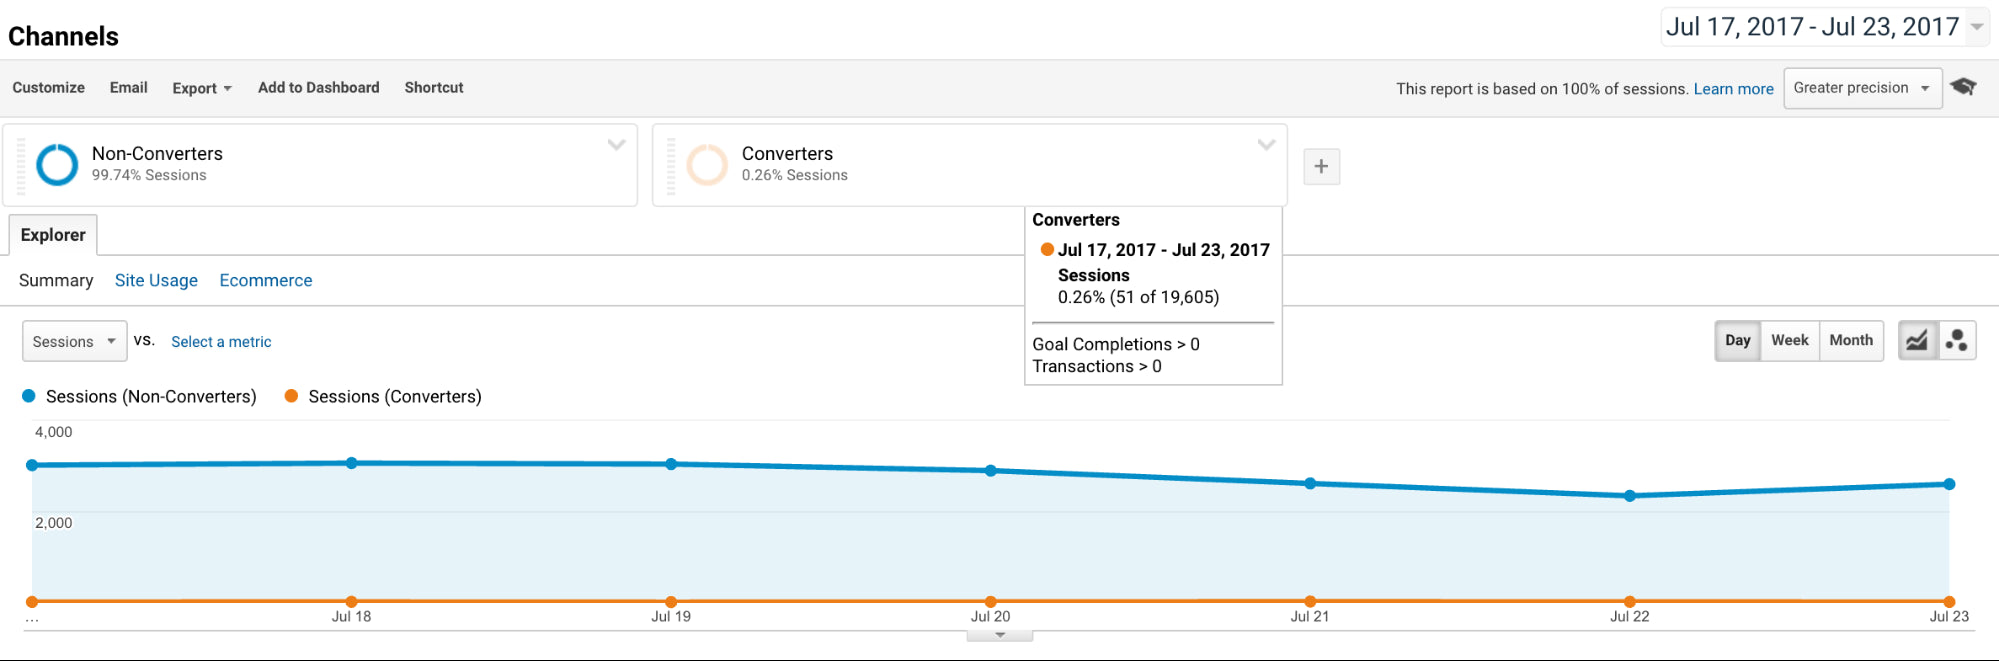
Likely, you have non-revenue goals in Google Analytics, so converters vs. non-converters is not the same as purchasers vs. non-purchasers.
You’ll want to create two new custom segments focused exclusively on revenue generated. Once you’ve done that, you can begin comparing the behaviors of the two segments.
What do purchasers do that non-purchasers do not? If you can answer that question, you can optimize your store to encourage the positive behaviors to eventually close more sales.
For example, if you notice that people who purchase from you are more likely to have read your blog than non-purchasers, you can:
- Double down on your blogging efforts. You now know this is a high-value activity.
- Encourage visitors to read your blog.
- Optimize your existing blog posts to move people to your store faster.
Of course, this is just one example. The list is endless.
You may also want to look at mobile purchasers vs. mobile non-purchasers. I recommend keeping this separate from desktop comparison as the mobile user experience and the desktop user experience are very different.
2. One-time buyers vs. multi-buyers
In a perfect world, your customers would come back to your site to purchase again and again, right? We’ll call those ideal customers multi-buyers.
In reality, I’m willing to bet you have a lot of one-time buyers. It’s ok, most stores do. Retention can be a very tricky thing.
What separates the one-time buyers from the multi-buyers, though? How does their behavior differ? Do they look at different things? Dwell on different pages? Come from different sources? Open different email campaigns?
Create two new custom segments and you can find out:
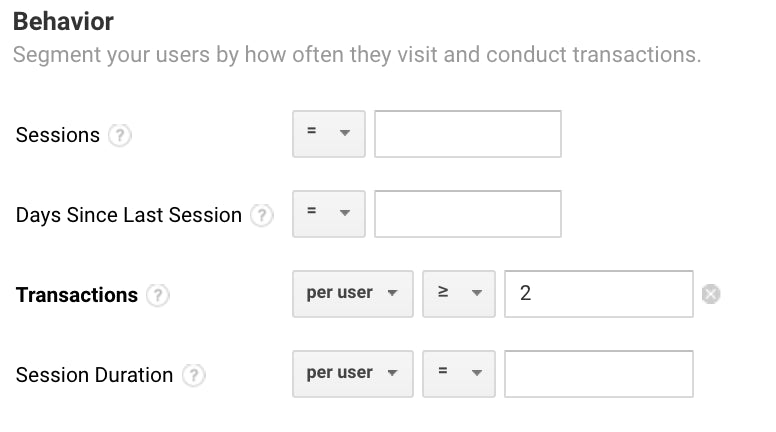
This will be your multi-buyer segment. You’ll also create a segment for those with exactly one transaction.
Then, start comparing! If you can find what sets these two groups apart and then encourage the one-time buyers to demonstrate the positive behaviors from the multi-buyers, you’ll be miles ahead of the competition.
The beauty of this is that the cost to reacquire a customer is much lower than the initial acquisition cost. Right? Because you might pay $10 to acquire them via a Facebook ad initially, but you could potentially reacquire them for a second purchase for the price of one email.
So, if you can solve your retention problem this way, you can make a big impact on your bottom line.
3. Cart abandoners (by source)
You know how when you’re walking through the grocery store, you see unattended shopping carts everywhere? No? That’s because cart abandonment isn’t normal, despite the fact that it’s been normalized online.
If you have a cart abandonment problem, you likely have either a user experience problem or a comparison shopper problem.
Comparison shopping is an entire article of its own, so let’s focus on user experience problems. These can either be universal or specific to the traffic source.
Yes, people coming from Facebook are quite different than people coming from Google. As a result, they expect (and need) a different user experience. They also have different motivations, levels of intent, etc.
So, you can create a Google Analytics custom segment for each of your major traffic sources:

Then, analyze and analyze some more. If you notice higher than average abandoned carts via Twitter, for example, poke around for some clues. What is it about Twitter visitors that makes them abandon their carts in the middle of the milk aisle?
You can repeat the same process for those who fall out of the funnel later on. For example, those who abandon half-way through the actual checkout process.
As a bonus, these segments might shed some light on which sources are the most valuable for you and which you can squeeze more value out of.
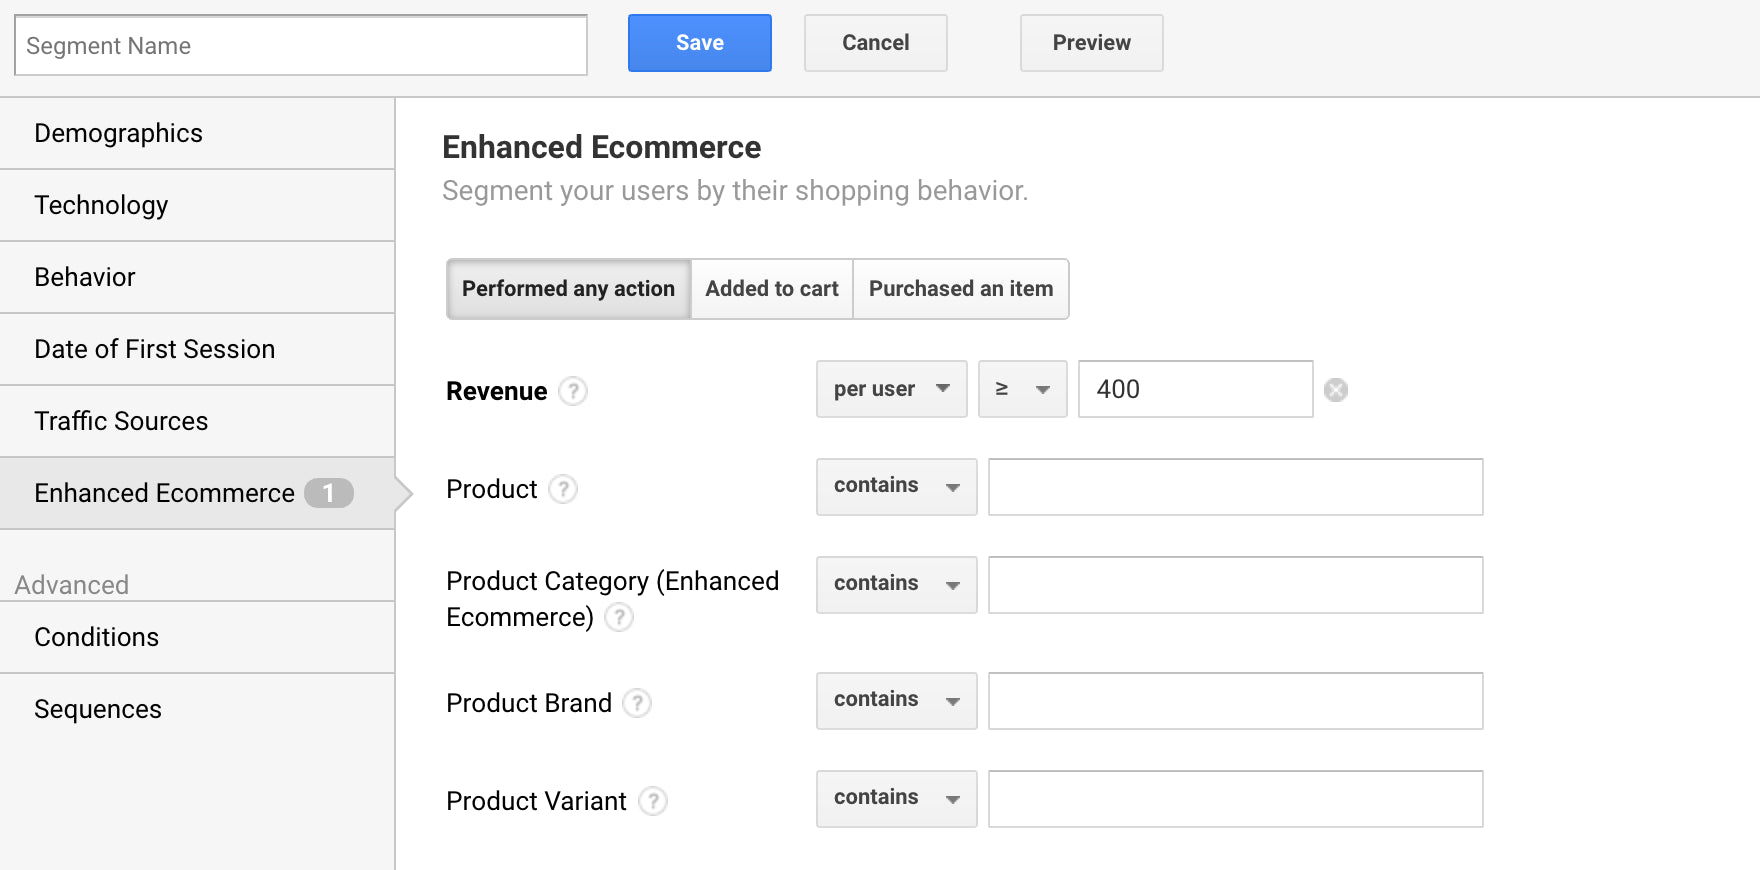
4. High-value customers
Let’s say your average order value (AOV) is $200. High-value customers are those spending two ($400) or three ($600) times that. It can be helpful to isolate those big spenders to understand who they are and explore how they behave.
First, the more you know about this segment, the better you can target them in future acquisition campaigns. Second, you can optimize your store and retention campaigns to encourage average customers to start behaving like high-value customers.
What campaigns are these high-value customers arriving via? What keywords? What traffic sources? What products are they purchasing? Do they purchase a couple expensive products or multiple inexpensive products?
Create the custom segment based on revenue to find out:
5. Keyword length
Organic and paid search traffic likely represent a big chunk of the acquisition pie for your store. It can be helpful to dive deeper into the keywords people are using to find your site and how those keywords influence behavior.
For example, how does someone who finds your store via “fashion” differ from someone who finds your store via “red and white summer dresses”?
To answer that question, you’ll need to create a series of keyword segments. Here’s one for keywords with four words:
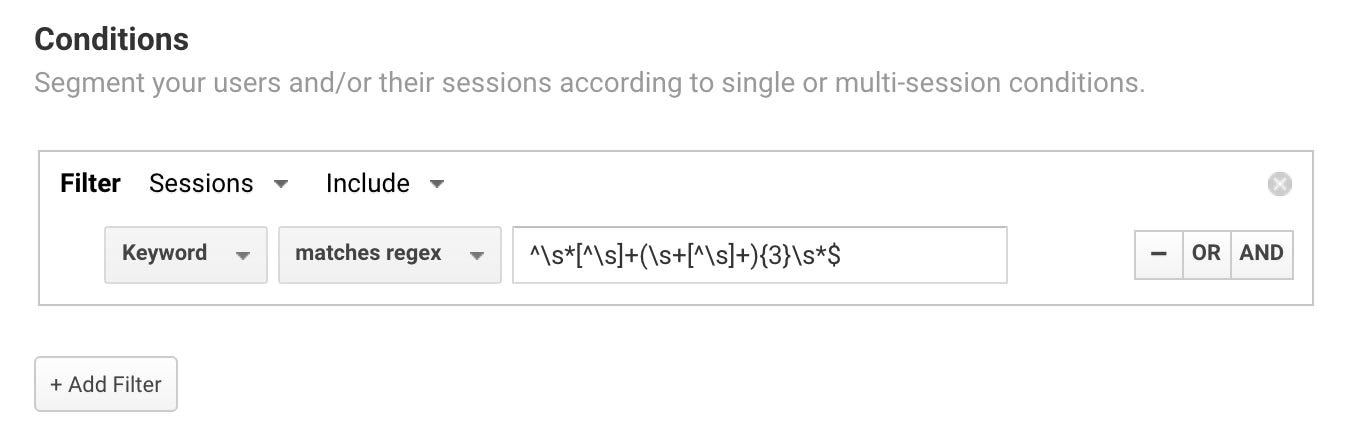
Now, this is a regular expression that I picked up from Avinash years ago. If you wanted to identify keywords with three words instead of four, you’d use this regular expression:
^\s*[^\s]+(\s+[^\s]+){2}\s*$
See the pattern? The numeric value in the regular expression is the number of words in the search query, minus one. Here’s the regular expression for keywords with five words:
^\s*[^\s]+(\s+[^\s]+){4}\s*$
Here’s where it gets really useful. If you want to isolate keywords with over, say, ten words, just add a comma to the regular expression:
^\s*[^\s]+(\s+[^\s]+){9,}\s*$
That would show you keywords with 10+ words.
Create four segments and apply them to get a better understanding of your search traffic.
Do short or long keywords generate the most revenue? Are you bidding on the right keywords? Are you writing content for the right keywords on your store’s blog?
Conclusion
Now that you have a better understanding of what’s below the surface in Google Analytics, you can start chipping away at that 91%.
You see, opening Google Analytics and checking around once or twice a month is about data. If you want to make it about insights you can actually use, you’re going to need to get your hands dirty and do some digging.
It’s all about customization and analysis, which is where simple and advanced segments come into play.
There are literally thousands to choose from, though, and I’ve only highlighted five of my favorites. What did I miss? What Google Analytics segments do you use to uncover hidden gems below the surface?
Haven't created your store yet?
No problem. Start your free trial of Shopify—no credit card required!
Google Analytics Segments FAQ
What are segments in Google Analytics?
What are the three levels of segments of Google Analytics?
- User-level: This level of segmentation focuses on individual users. It allows you to analyze data from specific users, groups of users, or all users.
- Session-level: This level of segmentation focuses on individual sessions. It allows you to analyze data from specific sessions, groups of sessions, or all sessions.
- Campaign-level: This level of segmentation focuses on individual campaigns. It allows you to analyze data from specific campaigns, groups of campaigns, or all campaigns.
Why use Google Analytics segments?
How do I see segments in Google Analytics?
- Log in to your Google Analytics account.
- In the left pane, click on the “Audience” tab.
- Under the “Audience” tab, click on “Segments”.
- You will see a list of pre-defined segments and the option to create custom segments.
- To see the segment you want to analyze, click on the segment name.
- You will see a graph showing the segment’s performance.

About the Author
Shanelle Mullin works on growth, experimentation, and conversion rate optimization at Shopify.
Topics:
Join 446,005 entrepreneurs who already have a head start.
Get free online marketing tips and resources delivered directly to your inbox.
Thanks for subscribing
You’ll start receiving free tips and resources soon. In the meantime, start building your store with a free 14-day trial of Shopify.


