
Ecommerce is bigger than ever. Experts predict that the industry will see 39% growth over the coming years, with shoppers expecting to spend a collective $8 trillion online by 2027.
With such explosive growth comes the opportunity to reach new shoppers and generate more revenue. That’s only possible if you know where the industry is heading, what customers expect, and how their purchasing habits are evolving.
Keeping your finger on the pulse of industry trends is important when it comes to staying ahead of competition. But identifying valuable insights within your own business is just as crucial for growing your online sales.
Many business owners have Google Analytics, but grossly underuse its data. They fall into the trap of leaving money on the table or making “improvements” that hurt more than they help. The secret lies within turning your metrics into actionable insights.
Here’s how you can uncover valuable ecommerce insights and start turning analytics into action—without costly software or a data science degree. Plus, we share seven ecommerce trends shaping the industry, with ideas on how to test them with your customers.
Table of contents
What are ecommerce insights?
An ecommerce insight is a conclusion made from analyzing data that can inform a direct change to your website, business, products, or marketing channels. If your sales data shows that conversion rates on product pages with reviews are 34% higher than those without, for example, your insight would be that social proof positively influences conversions.
Scaled, these insights can become industry-wide trends, illustrating the shifts, disruptions, growth, and challenges ecommerce businesses face.
Why are ecommerce insights important to track?
You can turn data into actionable ecommerce insights by asking specific questions you think will help you grow your business in the future. If market outlooks show that social commerce is on the rise, ask yourself: Have we seen an uptick in sales, conversion rates, or reach on the social media channels we’re using? If so, build your presence on the channels your target market is using to buy.
Ecommerce insights can also help you understand whether a decision you made to improve your business was effective.
Let’s say you overhauled your website to include pop-ups that directed customers to your live shopping experiences. Did the opt-in rate increase after you directed more customers there? Did customers who took part in a live shopping experience have a lower returns rate than average? Answering “yes” to either hypothesis shows it was a smart decision to action those insights.
7 ecommerce insights shaping the industry in 2024
- New social commerce platforms emerge
- Artificial intelligence supports purchase decisions
- Inflation is a concern for shoppers
- Buy now, pay later becomes the new norm
- Customers want a variety of fulfillment options
- Eco-conscious consumerism is on the rise
- Live commerce grows in popularity
1. New social commerce platforms emerge
Social commerce is when customers buy products through a social network. Although the concept is nothing new, the channels that consumers are using to form their purchase decisions are changing.
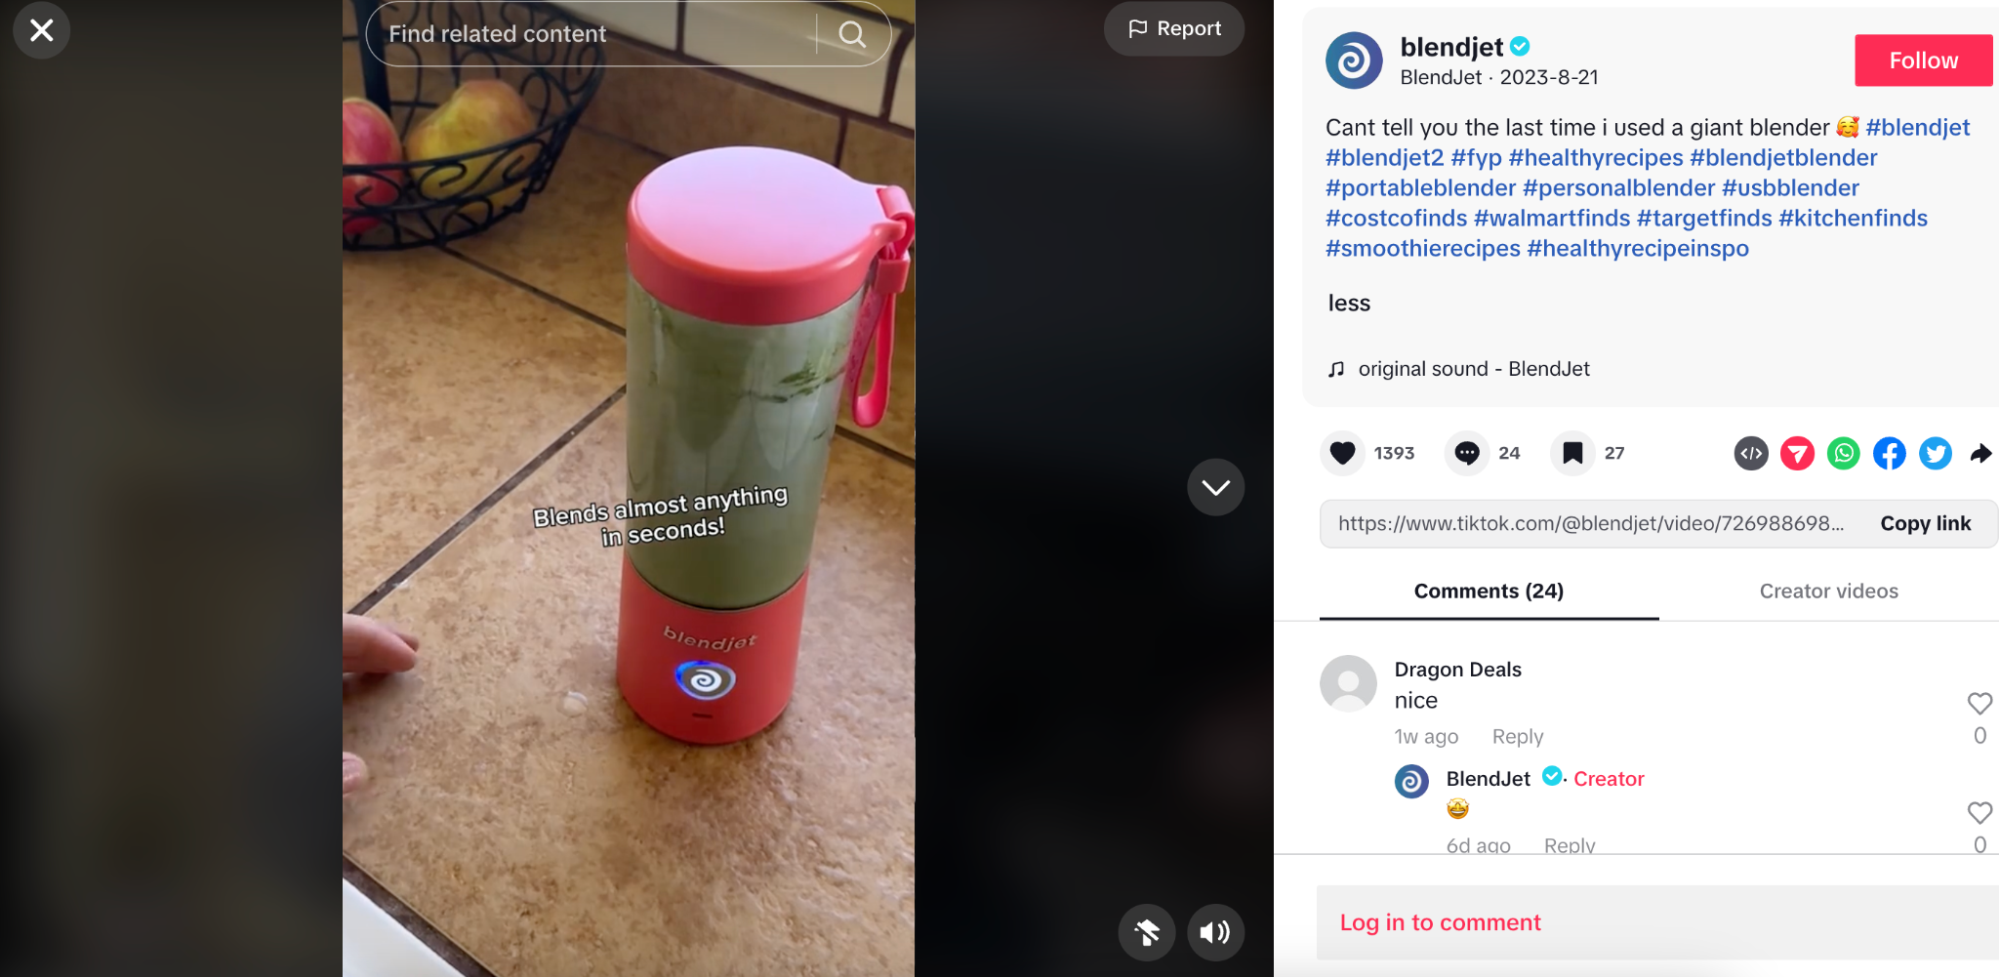
Instagram is still the frontrunner, but brands on new apps like TikTok and Twitch are turning followers into sales. TikTok, in particular, has 33.3 million buyers—39% of whom have bought something they discovered on the platform.
It’s not just brands that are responsible for driving website traffic from social media. Creators with fewer followers and a knack for creating short-form videos are providing ecommerce brands with user-generated content (UGC) they can repost to their own feeds. This type of content appears more trustworthy from someone who looks familiar, rather than a faceless brand.
Confirm whether this is the case for your own store by monitoring store sessions, customer acquisition costs (CAC), and customer lifetime value (CLV) by traffic source. Focus on the front runners to turn social commerce into a money-maker for your business.
2. Artificial intelligence supports purchase decisions
Artificial intelligence (AI) is the buzzword of the year. It seems like machine learning technology is infiltrating every aspect of our lives, and 45% of US adults are “equally concerned and excited” about the thought of it.
Personalization is just one aspect that’s infiltrating ecommerce. Some 73% expect personalized shopping experiences, and many will exit an online store if they aren’t offered it. This highly targeted experience is possible at scale with AI. It can analyze a shopper’s browsing history and recommend products they’re likely to be interested in.
Confirm this hypothesis for your ecommerce store by experimenting with retargeted ads. If your customers are on Facebook, for example, use the Meta pixel to run a campaign that targets people who have:
- Visited specific URLs on your online store (i.e., product pages)
- Visited specific URLs but not others (i.e., your category page but not a product page)
- Added a product to their shopping cart but failed to check out
To test this, create two ad sets for each segment: one that uses dynamic campaigns to display previously viewed products; the other that shows items you assume they’ll be interested in. Compare the conversion rate across both. You’ll likely find that the AI-powered campaign has a much higher return on investment (ROI).
3. Inflation is a concern for shoppers
Customers have always shopped around for the best deal. The discounts modern shoppers are looking for, however, are bigger than ever before. Inflation is at its highest rate in years and more than half of shoppers are cutting down on everyday expenses to save money.
Combine this ecommerce insight with your own data to run targeted promotions. Instead of offering blanket deals to anyone and everyone, reserve your best deals for:
- Slow-selling products so you can turn inventory around quicker
- People who’ve abandoned their shopping cart
- Old customers who haven’t purchased in a long time
If promotions are off the table but you still want to capture shoppers who are cost-cutting because of inflation concerns, consider bundling your top-selling items or offering gift cards. Both options lessen the hit on your profit margins while increasing average order value (AOV).
4. Buy now, pay later becomes the new norm
Buy now, pay later (BNPL) is a consumer trend that has grown in popularity over recent years. A quarter of shoppers have used a BNPL service, and this figure will increase dramatically amongst Gen Zers—47% of whom will use BNPL services by 2025.
This is especially important for high-sales periods like the Black Friday Cyber Monday (BFCM) weekend. To prepare, analyze the most popular payment method amongst online shoppers last year. If you’re like most businesses, BNPL was up there. Consumers spent a collective $8.3 billion on products they bought and paid for later during 2023’s BFCM weekend alone.
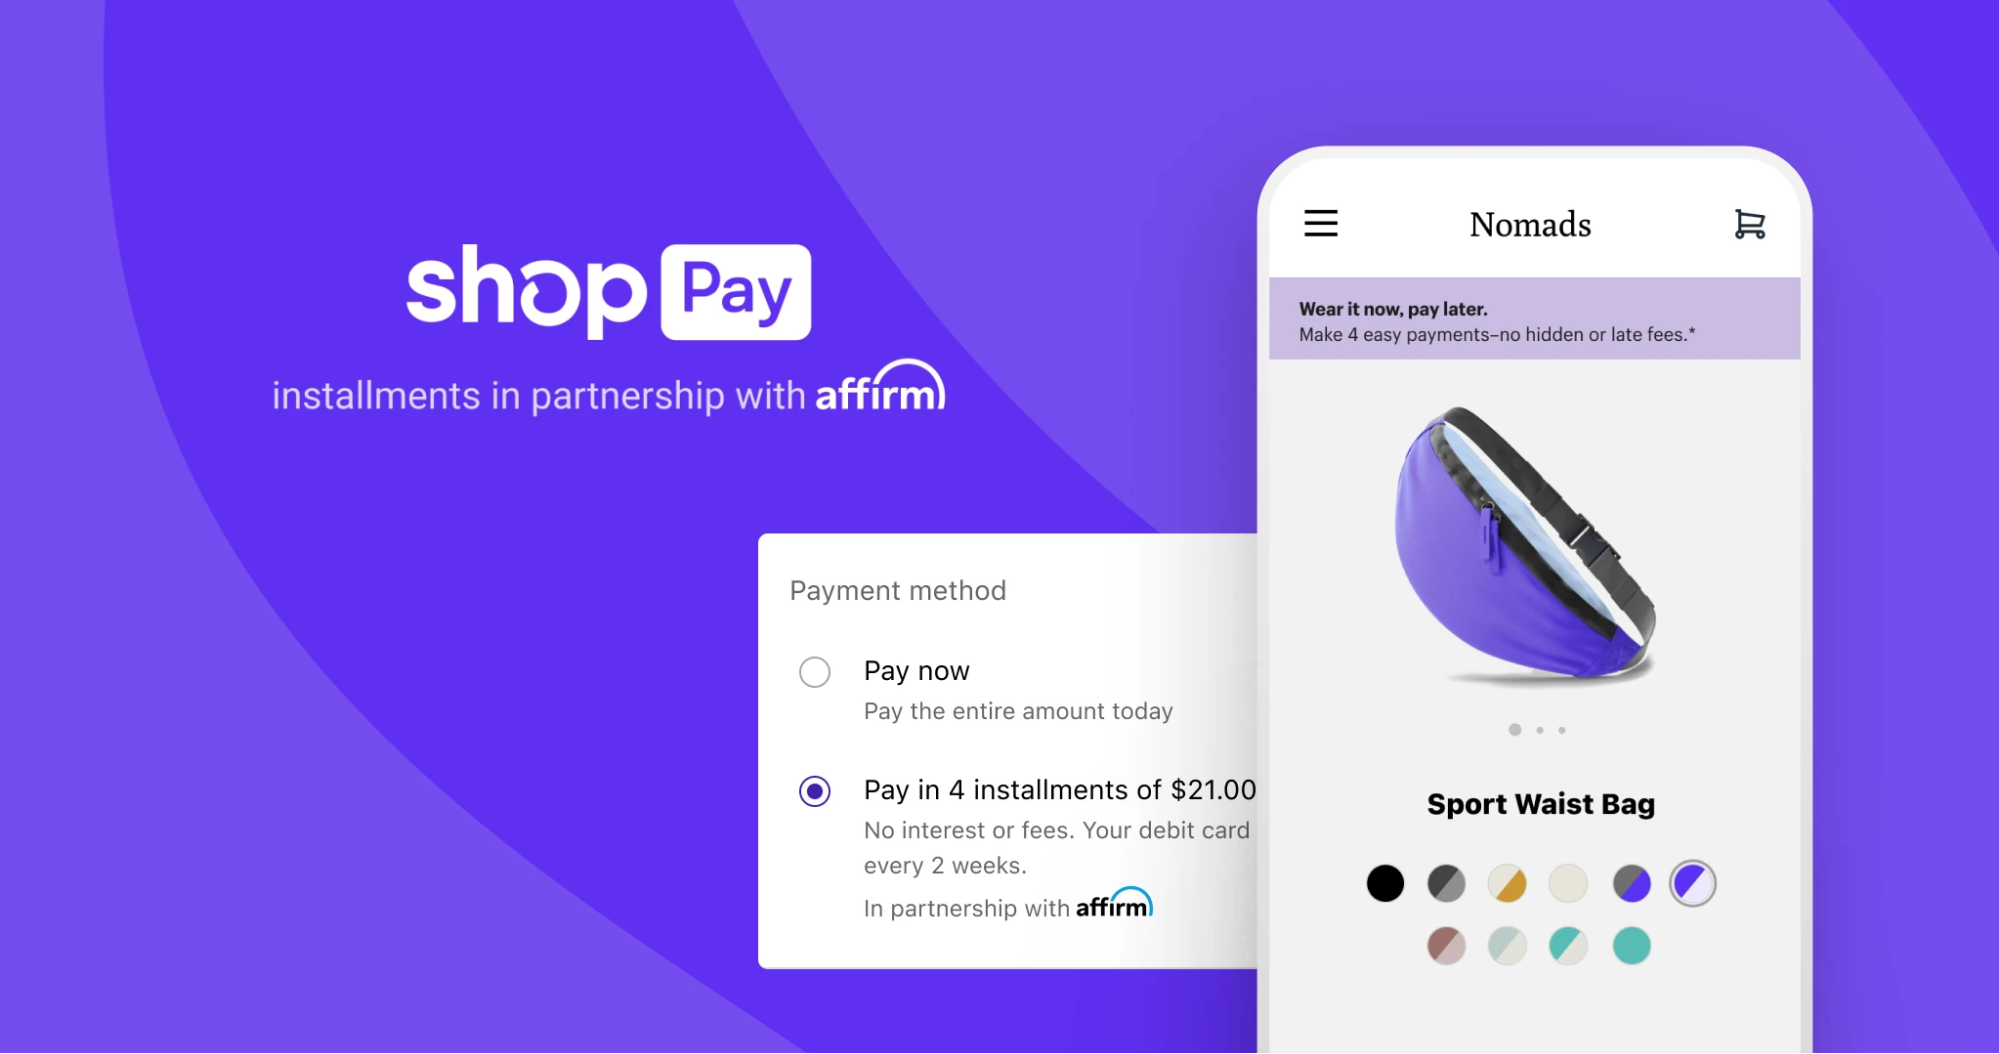
If you find that your shoppers are following the BNPL trend, offer it as a payment option. Shop Pay Installments allows people to buy products and spread the cost over four installments. The merchant still gets the full order value upfront; it’s Shopify’s job to recoup the revenue when customers pay in chunks.
5. Customers want a variety of fulfillment options
In-person shopping has made its gradual return after we were forced to shop online. Studies estimate that in-store sales will hit $7.9 trillion by 2026—and it could be impacting ecommerce metrics like cart abandonment rate.
Benchmark your cart abandonment rate by device against the 70.19% average. If you find that more shoppers abandon their cart on mobile, segment them by location within a 10-mile radius of your stores. Check your point-of-sale (POS) dashboard. Have any of the people who abandoned their cart ended up buying in-store?
This is a great example of how the first data point you find isn’t enough to form an accurate ecommerce insight. Cart abandonment rate alone might be going down, but you’re not necessarily losing all of those shoppers—they’re just heading in-store instead.
6. Eco-conscious consumerism is on the rise
Some 30% of shoppers want to buy from brands that help them improve the environment. Six in 10 would even pay more for products that have sustainable packaging.
If your business has sustainable practices, try confirming this insight by A/B testing the impact of words like “sustainability,” “eco-friendly,” or “environmentally friendly” on your product pages. Remember: It’s not enough to just say these words. Over half of fashion shoppers don’t trust a brand’s sustainability claims, so you need to follow through on your promise and provide evidence of you doing so.
You could also monitor the effectiveness of apps like Planet. The Shopify tool offers carbon neutral shipping by donating money from every order to nonprofits that save the planet. If you see metrics like conversion rate increase and cart abandonment decrease (without making any other changes to your store), it supports the hypothesis that consumers want to support eco-friendly brands.
7. Live commerce grows in popularity
Live commerce is a type of ecommerce that happens in real-time. Ever since Li Jiaqi, one of China’s leading influencers, sold $2 billion worth of inventory in a single livestream, brands are pivoting to this marketing channel as a way to build connections with their audiences and turn them into customers.
Fashion brand Luxe Collective takes live commerce one step further with its personalized virtual shopping service. It sells expensive bags, jewelry, and shoes through its online store—fashion items that are notorious for high return rates. Yet when online shoppers can see the 360-view of a product and get information from its sales representatives live, it’s easier to close the deal.

How to analyze ecommerce insights
Curious to learn whether these ecommerce industry insights apply to your business? Here’s how to turn data into insights for your own store.
Form a hypothesis
What do you want to know about your website, marketing, customers, or products? And, more importantly, what will you do with the answer?
“There’s no such thing as a single source of truth for all your answers,” says Daniel Patricio, owner of ecommerce food brand Bull & Cleaver. “Different views into your analytics will answer different questions. So the most important question to start with is, ‘What are you actually trying to answer?’”
A single good question can lead to an answer that leads to more questions that lead to even more answers—rabbit holes pop up naturally when you start digging into your ecommerce analytics. Without a question as a starting point, though, you’re left wading through your data analysis without a direction, which wastes time.
Examples of good questions to ask can range from:
- How has traffic to our landing pages changed over time?
- How many visitors add an item to their cart without checking out?
- Where am I losing most people in the checkout process?
- How likely to purchase are visitors from social media campaigns compared to visitors from email campaigns?
- Did adding that pop-up to your website two months ago help or hurt conversions?
- How are visitors behaving on our shop page?
- What can we learn from our product pages?
- What was the return on investment of my Google Ads campaign last month?
Gather the data
Now you know what you’re investigating, the next step is to collect data from all channels that have an impact on your store. This data enables you to analyze customer behavior, measure website traffic, and gain product insights.
The latest version of Google Analytics—a popular free analytics platform and one you’ll likely be using—gives quick and easy access to basic data to compare behavior between different segments of your audience, and customize reports and actionable data explorations.
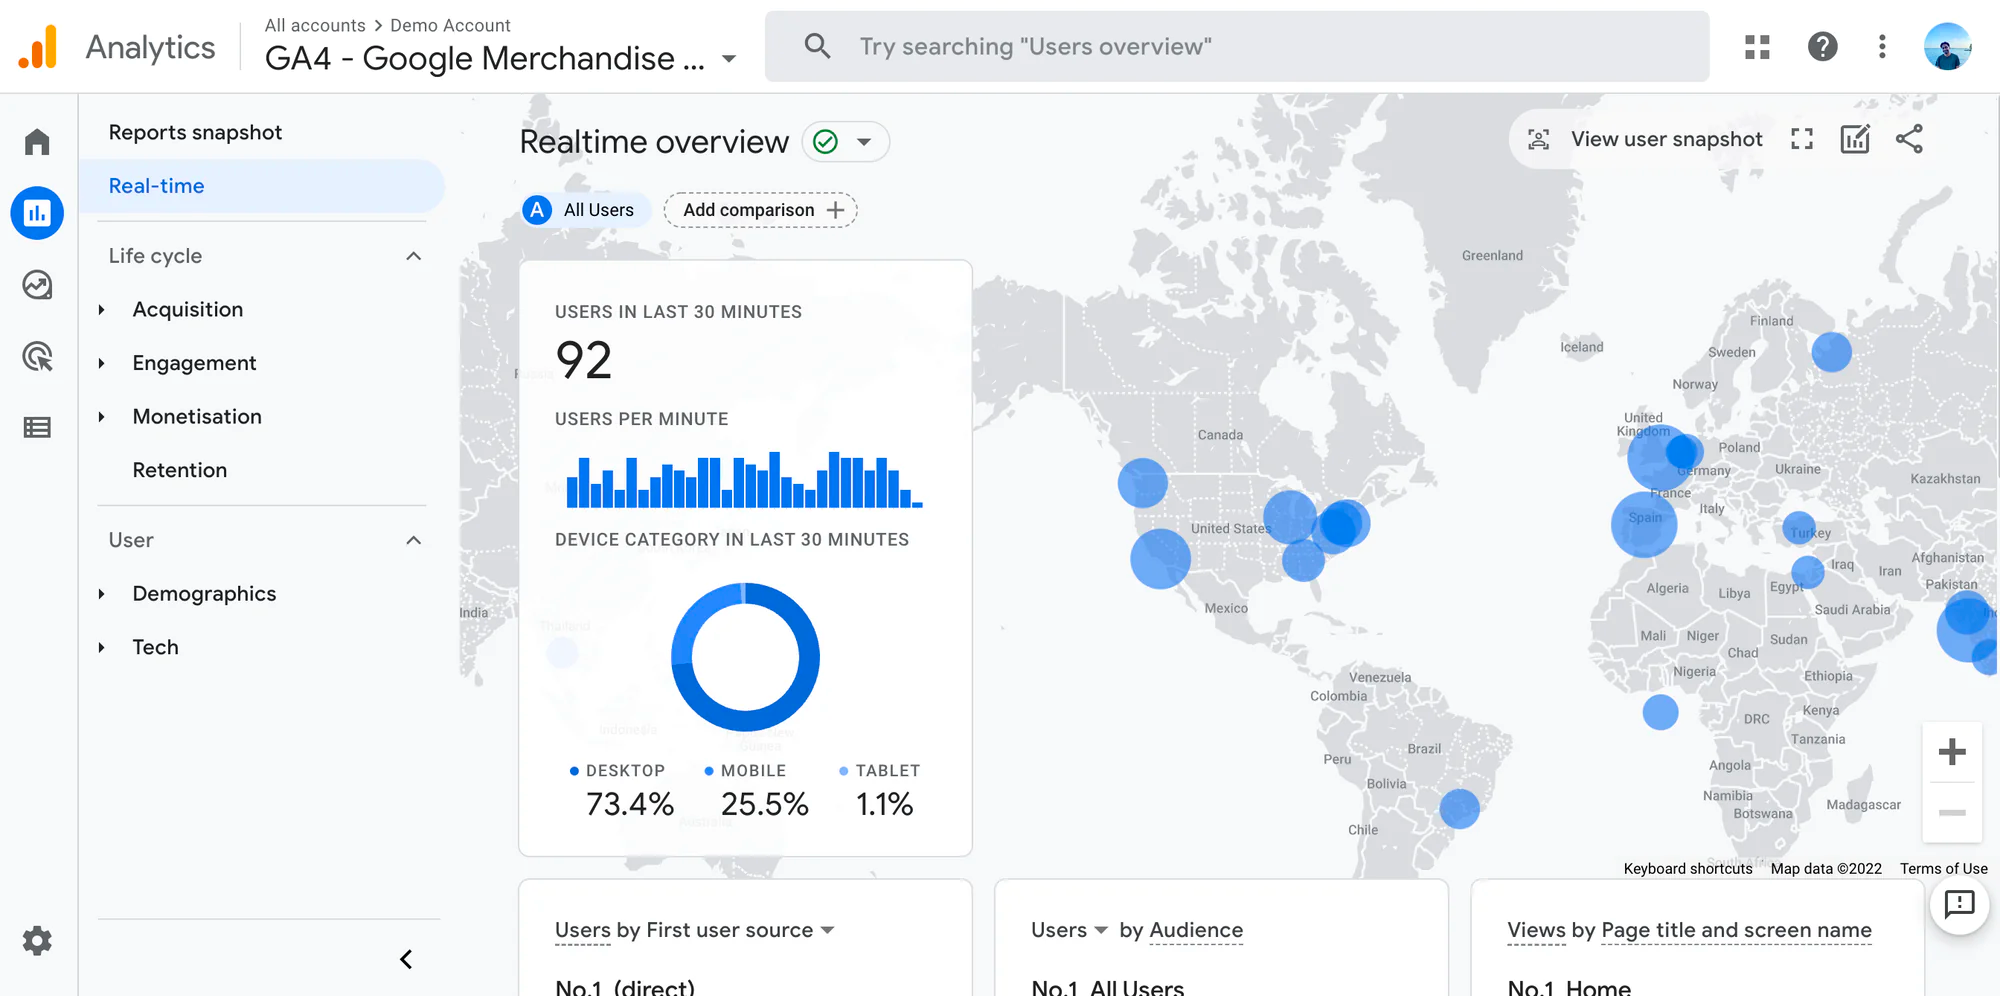
Depending on your setup, however, your out-of-the-box analytics tool may be insufficient for finding more granular ecommerce insights. You may need to customize your GA dashboard, look at your Shopify store data, or even add a new analytics tool entirely.
The last thing you want is to make business decisions based on an incomplete picture.
Common scenarios for expanding your analytics for ecommerce insights include:
- Enabling enhanced ecommerce tracking in Google Analytics so you can track individual stages (like product views, add to cart, etc.) in the purchasing process for specific products
- Creating custom events in Google Analytics to track micro-conversions such as newsletter signups
- Customizing columns in your Facebook Ads Manager so you can measure the frequency your audience is seeing your ads or the cost per page like
- Generating a custom report in Shopify to analyze which products your customers are returning the most often
- Implementing heat maps through a tool like Hotjar or Lucky Orange (Shopify app) to analyze browsing behavior on your product pages to see what sections are capturing their curiosity
Form your ecommerce insight
At this point, it’s time to evaluate whether your hypothesis was accurate. Use the data you’ve pulled from various sources and slice it to dig deeper into what’s happening across your ecommerce business.
Don’t fall victim to confirmation bias—the tendency to look for supporting evidence to prove your hypothesis was correct and ignore evidence that goes against it. Be objective: Look at the data as it appears and follow any indications that might prove your hypothesis is wrong.
“Behind every digital tool and dataset are real people making thoughtful choices,” says Josh Neuman, founder of Chummy Tees. “While we let data guide us, there's still lots of good old-fashioned intuition involved! Figuring out what the numbers actually mean takes experience.”
How to turn ecommerce insights into action
Use purchase data to optimize your social media strategy
When you have so many moving parts across your business, it becomes increasingly important to monitor how optimizing in one area can affect another. When marketing insights showed how powerful Bull & Cleaver’s taster pack was for converting first-time purchasers, Daniel Patricio decided to experiment with sending more traffic to that page.
It’s easier to experiment confidently like this when you can monitor the trade-offs and downstream effects of decisions like redistributing your traffic. If there turns out to be a negative impact of some kind, analytics can act as a tripwire.
Use conversion rates to prioritize popup offers
With so many different product flavors, a natural source of friction on the path to purchase is deciding which one to try first. Daniel’s solution was a taster pack for first-time customers to sample his most popular products.
It was so effective at converting customers that he decided to roll that insight out across his business, prioritizing bundles at the top of the shop page.
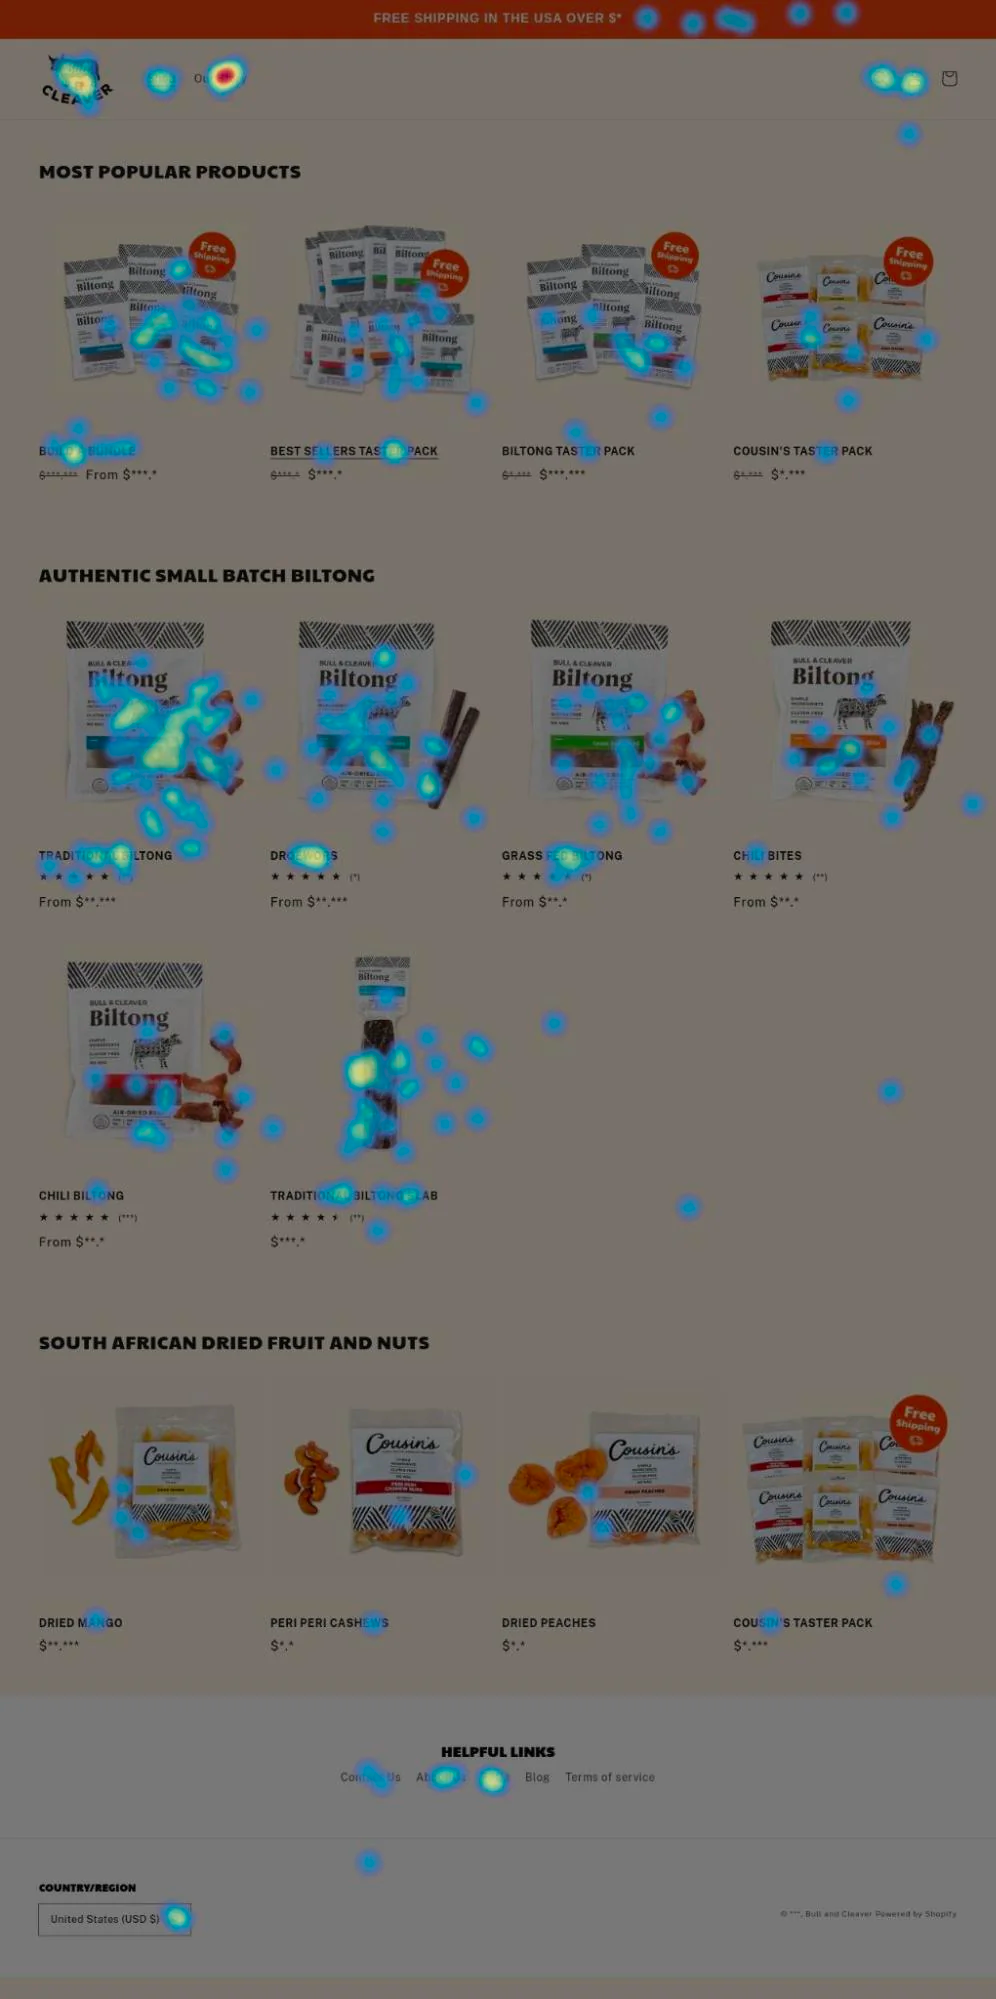
Google Analytics showed traffic to the page was fine but conversions were down. So he looked at a heat map tool to see where visitor attention and clicks were going. What he found was people were skipping the bundles and scrolling down. Once he saw the data, it seemed obvious—shoppers wanted to know more about the individual products before purchasing a bundle.
He was able to course-correct thanks to this feedback loop, move the taster bundles further down, and improve the conversion rate on the shop page by nearly 20%.
Use AOV to replenish best selling products
There can be many reasons why a healthy metric randomly falls, like in the case of Bull & Cleaver, which saw a drop in average order value for returning customers. The drop was obvious, but was it a change in the marketing strategy, the website itself, or just seasonal demand? Turns out, they were sold out of a key product because they were planning to expand the product line before relaunching it.
It’s easy to jump to conclusions based on the performance of a single metric, so it’s important to ask: What other related metrics could be influencing it too? In the case of AOV, it’s individual product sales.
Daniel ended up creating a simple spreadsheet to get to the root cause and noticed sales of one product had gone down to almost zero.
Here’s how much each product contributed to total sales from one month to the next:
- Bulk: 45.88% → 34.57%
- Bundle: 32.61% → 44.57
- Slab: 9.45% → 0.69%
- Snack: 12.06% → 20.18%
The sold-out product had actually brought down a lot of averages, but average order value for returning customers took the biggest hit.
This ecommerce insight showed that the product was in demand, especially with existing customers, and so he should work to expand the product category. This has Daniel excited to relaunch the product soon. In the meantime, he’s managed to get sales back on track without it and anticipates a boost in sales and customer retention when it is relaunched.
What questions will you ask your analytics?
Ecommerce insights can be overwhelming at first, and no one becomes data literate overnight. But over time, question after question and answer after answer, you can learn how to be curious about different areas of your business and where to look for answers.
Drive your business forward with Shopify’s analytics
Shopify's user-friendly reports and analytics capabilities help you make better decisions, faster. Choose from pre-built dashboards and reports or build your own to spot trends, capitalize on opportunities, and supercharge your decision-making.
Explore Shopify’s analyticsEcommerce insights FAQ
What is an actionable insight in ecommerce analytics?
How does ecommerce analytics differ from ecommerce insights?
What is the future of ecommerce?
Is the ecommerce industry growing?
Topics:
Join 446,005 entrepreneurs who already have a head start.
Get free online marketing tips and resources delivered directly to your inbox.
Thanks for subscribing
You’ll start receiving free tips and resources soon. In the meantime, start building your store with a free 14-day trial of Shopify.


